.jpeg)
경쟁 맥락에서의 비시장 전략: 탄소 성과와 기업 가치
Non-market Strategy in Competitive Contexts: Carbon Performance and Firm Value
1 고려대학교
1 Korea University
DOI: https://doi.org/10.17287/kmr.2026.55.1.229
초록
기업은 시장 가치와 사회적 가치를 동시에 창출해야 한다는 압력에 직면해 있으며, 이에 따라 비시장 전략은 지속적인 경쟁 우위를 유지하는 데 핵심적인 요소가 되고 있다. 기업의 탄소 경영에 대한 요구가 높아지는 상황에서 기존 연구들은 탄소 성과와 기업 가치 사이의 관계를 조사해 왔다. 그러나 이러한 연구들은 기업이 처한 경쟁 맥락을 대체로 간과함으로써, 광범위한 산업 동료가 아닌 실제 경쟁자를 염두에 두고 추진되는 비시장 이니셔티브의 전략적 가치를 모호하게 만들었다. 본 연구는 직접적인 경쟁자 대비 기업의 탄소 성과가 시장 가치 평가에 어떠한 영향을 미치는지 조사함으로써 이러한 공백을 메우고자 한다. 텍스트 기반 네트워크 산업 분류를 사용하여 기업별 경쟁자를 식별하고 제품 시장 유사성에 기반한 경쟁 강도의 변화를 포착하였다. 연구 결과, 상대적으로 우수한 탄소 성과는 기업 가치를 높이지만, 이러한 효과는 치열한 경쟁 압력 하에서는 약화되는 것으로 나타났다. 반면, 녹색 혁신과 광고를 통한 차별화는 가치에 미치는 영향을 증폭시킨다. 본 연구의 결과는 경쟁 맥락을 가치 창출의 결정적 요인으로 설정하고, 시장 우위를 강화하기 위해 비시장 전략과 경쟁 전략을 정렬하는 것의 중요성을 입증함으로써 비시장 전략 연구를 확장한다.
Abstract
Firms increasingly face pressure to create both market and societal value, making non-market strategies central to sustaining competitive advantage. In the context of rising demands for corporate carbon management, prior research has examined the relationship between carbon performance and firm value. Yet, these studies largely overlook the competitive contexts in which firms operate, thereby obscuring the strategic value of non-market initiatives that are ultimately pursued with rivals, not broad industry peers, in mind. This study addresses that gap by investigating how a firm’s carbon performance relative to its direct competitors affects market valuation. Using a text-based network industry classification, we identify firm-specific rivals and capture variation in rivalry intensity based on product-market similarity. We find that superior relative carbon performance enhances firm value, but this effect weakens under intense competitive pressure. By contrast, differentiation through green innovation and advertising amplifies the value impact. Our findings extend non-market strategy research by positioning competitive context as a critical determinant of value creation and by demonstrating the importance of aligning non-market and competitive strategies to strengthen market advantage.
Ⅰ. Introduction
In today’s business environment, firms face a dual mandate: to create consumer value and maximize profits while also addressing pressing societal challenges (Edmans, 2021; Lee et al., 2022). This evolution reflects the growing recognition that non-market strategies, coordinated actions outside traditional market exchanges, have become integral to sustaining competitive advantage as the boundaries between market and non-market domains blur (Aguinis and Glavas, 2012; Bach and Allen, 2010; Dorobantu et al., 2017; Lewin et al., 2022). Because many non-market initiatives are ultimately designed to secure an advantage or mitigate disadvantages relative to rivals, competitive dynamics necessarily extend beyond product markets into the non-market arena (Baron, 2013). In the competitive strategy literature, it has long been established that firms do not compete symmetrically with all industry peers but instead concentrate their rivalry on a narrower set of competitors, often conceptualized as strategic or competitive groups (Hunt, 1972; McGee and Thomas, 1986; Short et al., 2007). Within these groups, rivalry is not uniform but dyadic and asymmetric, intensifying where firms exhibit greater similarity and market overlap (Chen, 1996). Such rivals provide salient reference points for managerial decision-making, shape competitive actions, and influence firm performance (Derfus et al., 2008; Panagiotou, 2007). Yet, despite these insights, the role of competitive groups and rivalry intensity in shaping non-market strategies remains underexplored.
Among non-market challenges, climate change and the carbon transition have become particularly salient (Doh et al., 2021; George et al., 2016). Firms now devote significant resources to carbon management, viewing it not only as a societal responsibility but also as a potential source of competitive advantage (Aguilera et al., 2021; Wright and Nyberg, 2017). Prior research generally finds that improved carbon performance enhances long-term firm value, yet most studies rely on industry-level controls (Aswani et al., 2024; Benkraiem et al., 2022; Flammer, 2013), an approach that obscures the relational nature of competition. Standard industry classifications often group together firms with very different competitive pressures and fail to capture dynamic shifts in market positioning (Cao et al., 2019).
To address these limitations, this study examines how a firm’s carbon performance, measured relative to its direct competitors, influences market valuation. We employ the text-based network industry classification, which constructs rivalry networks by analyzing the similarity of firms’ 10-K business descriptions and updates annually to reflect evolving competition (Hoberg and Phillips, 2016). Using data on 1,023 U.S. firms from 2014 to 2021, we find that superior carbon performance relative to rivals is positively associated with firm value. However, this effect is significantly weaker in contexts of heightened competitive pressure, suggesting that short-term survival imperatives can limit the valuation premium attached to carbon leadership. By contrast, differentiation strategies, particularly those built on green innovation and advertising, reinforce the value of carbon performance, enabling firms to translate environmental commitments into sustained competitive advantage.
Our findings advance the non-market strategy literature by situating carbon management within the competitive contexts in which firms actually operate. Recognizing that firms’ non-market strategies are ultimately evaluated relative to their direct rivals rather than all industry peers, we examine how such competitive framing shapes the valuation of carbon performance. The results show that the strategic value of carbon efforts depends on both rivalry intensity and their alignment with competitive strategy. By bridging non-market and competitive perspectives, we find that differentiation through green innovation and targeted communication provides a reliable pathway for translating superior carbon performance into firm value, whereas cost-based approaches remain more contingent and uncertain. For managers, these results underscore the importance of benchmarking carbon performance against direct rivals, assessing competitive pressure when forming valuation expectations, and aligning carbon initiatives with differentiation strategies as a means of creating enduring value.
Ⅱ. Literature Review and Hypothesis Development
2.1 Non-market Strategy in Competitive Contexts
Beyond their traditional role as economic entities focused on competing in the market to generate consumer utility and profits, firms are increasingly recognized as essential contributors to society, entrusted with the responsibility of creating social value (Edmans, 2021). This broader mandate has intensified the importance of the non-market environment, which consists of the complex interplay of social, political, and legal forces that surround and influence market activity (Bach and Allen, 2010). In this evolving context, companies are adopting non-market strategies, defined as deliberate and coordinated actions in the non-market sphere that are intended to secure sustained competitive advantages in the marketplace (Baron, 2013).
Although the study of non-market strategies has a longstanding history, its importance has grown considerably in recent years, driven by the rise of grand challenges such as climate change, geopolitical instability, and societal upheaval in an increasingly interconnected world (George et al., 2016; Ghauri et al., 2021; Mellahi et al., 2016). Non-market strategies vary widely in form and intent. Some firms adopt a reactive stance, directing resources toward meeting regulatory requirements, while others pursue proactive approaches that frame non-market demands as strategic opportunities, shaping, influencing, or even redefining the rules that govern them (Dorobantu et al., 2017; Wartick and Cochran, 1985). When implemented effectively, non-market strategies can enhance market advantages by building legitimacy and reputation, unlocking market opportunities, lowering regulatory compliance costs, and fostering greater trust in capital markets (Ambec and Lanoie, 2008; Mellahi et al., 2016).
Firms design non-market strategies not in isolation but in response to the competitive contexts in which they operate, seeking to strengthen their position relative to key market rivals (Baron, 2013). The competitive strategy literature has long recognized that rivalry is not uniform across all firms in an industry. Early research introduced the concept of strategic groups, clusters of firms sharing similar resources, strategic characteristics, and market scopes, within which competitive interactions are most salient (Cool and Schendel, 1987; Lewis and Thomas, 1990; McGee and Thomas, 1986; Porter, 1980). Strategic groups serve as both analytical and managerial reference points. Managers benchmark their firms against peers in the same group, adjusting strategies in response to observed behaviors (Panagiotou, 2007). Group membership also shapes competitive dynamics, influencing the number and speed of competitive actions (Derfus et al., 2008). These findings highlight that firms most often orient their strategies toward a subset of strategically similar rivals.
Research on rivalry has further refined the notion of competitive peers by moving from group-level comparisons to dyadic relationships. Chen (1994; 1996) demonstrated that competition is concentrated within specific rival pairs, where mutual awareness, motivation, and capability shape interactions. This dyadic view evolved into network-based approaches, showing that the structure and intensity of competitive ties vary across firms (Baum et al., 2004; Baum and Korn, 1996). These studies underscore that rivalry intensity is heterogeneous even within strategic groups.
Despite these insights, most non-market strategy research continues to rely on broad industry classifications when evaluating performance outcomes. Studies typically acknowledge that competitive positioning matters but assess it at the industry level, overlooking variation in rivalry intensity within the industry (Benkraiem et al., 2022; Chatterji et al., 2009; Flammer, 2013; Harjoto and Laksmana, 2018). As a result, the competitive relevance of non-market strategies is likely understated. A notable exception is Cao et al. (2019), who investigated peer effects in CSR adoption among product-market rivals. They found that a firm’s CSR adoption influences rivals’ engagement, that peer effects are stronger in markets with high competitive pressure, and that CSR proposal passage at one firm reduces rivals’ cumulative abnormal returns. These results demonstrate that differentiated non-market strategies can yield competitive advantage within a peer group, although their study did not account for variation in rivalry intensity between focal firms and peers.
2.1.1 Climate Change and the Non-Market Imperative
Climate change has emerged as one of the most pressing grand challenges of our time, exerting a profound influence on the non-market environment (Doh et al., 2021; Howard-Grenville et al., 2014). Heightened awareness of its destructive impacts, amplified by the rising frequency and severity of natural disasters, has mobilized governments, non-governmental organizations, activists, and citizens to advocate for stronger climate mitigation measures, and this momentum has reshaped regulatory and legal frameworks. As major contributors to carbon emissions, a primary driver of climate change, firms now face intensifying demands for climate action (Ben-David et al., 2021; Zhang et al., 2020).
Thus, carbon emissions have become a material factor not only affecting firms’ reputations and legitimacy but also influencing financial performance directly through mechanisms such as carbon taxes and emissions trading systems (Bai and Ru, 2024; Colmer et al., 2025). Despite mounting pressure, firms’ responses vary widely. Achieving meaningful reductions often requires substantial resource commitments to modify products, processes, and supply chains, making it a costly endeavor (Włodarczyk et al., 2024). Some firms adopt proactive strategies, while others respond more passively, reflecting differences in beliefs about the current and future costs of carbon emissions (Ramadorai and Zeni, 2024).
2.1.2 Carbon Performance and Firm Value in Competitive Contexts
As pressure on carbon management intensifies, firms are adopting diverse responses, prompting research into how this non-market strategy influences market performance. While prior research on carbon performance finds mixed short-term effects due to cost pressures, it generally shows a positive long-term valuation as markets recognize the future benefits are at work (Busch and Lewandowski, 2018; Dixon-Fowler et al., 2013; Lee and Byun, 2016). Yet these studies typically account only for industry-level heterogeneity, overlooking the subset of direct rivals that firms most actively monitor and compete against in both market and non-market arenas, as well as variation in rivalry intensity within such dyads (Arian and Sands, 2024; Aswani et al., 2024; Benkraiem et al., 2022).
Examples illustrate the limitations of broad industry definitions. Coca-Cola and PepsiCo are primary reference rivals in both market competition and carbon management (Carbon Credits, 2025), despite sharing only a three-digit Standard Industrial Classification (SIC) code, while Coca-Cola shares the four-digit SIC code with Primo Brands, a niche bottled water company that is far less strategically relevant. In the petroleum sector, Exxon Mobil’s large-scale carbon capture and storage (CCS) initiatives are more directly shaped by rivalry with Chevron, a global energy competitor in oil, gas, and CCS, than with smaller refiners like PBF Energy or Delek US Holdings, even though they share the same SIC code (2911, “Petroleum Refining”). Moreover, Occidental Petroleum, classified under SIC 1311 (“Crude Petroleum and Natural Gas”), may represent an even more salient CCS rival.
These cases demonstrate how conventional industry boundaries can obscure the most relevant competitive relationships, sometimes grouping together firms in cooperative supply chains where one firm’s carbon improvements do not weaken a partner’s market position. In practice, firms seldom design carbon strategies with reference to every firm in their industry; instead, they align with the behaviors and intensity of competition among their most direct rivals. Consequently, industry-level results in prior studies may not accurately capture how carbon performance relative to such rivals is assessed and reflected in market valuation.
Superior carbon performance relative to direct competitors can shape the reactions of salient stakeholder groups whose support underpins firm value (Freeman, 1984; Ioannou and Serafeim, 2015). Institutional investors, regulators, and large customers increasingly rely on comparative carbon metrics when allocating capital, awarding contracts, or granting regulatory leeway. By outperforming key rivals, a firm demonstrates responsiveness to stakeholder pressures and reduces perceived non-market risks, which can translate into lower cost of capital and preferential access to resources (Krüger, 2015). This comparative advantage may also strengthen supply-chain partnerships and reputational ties with community actors, which together enhance the durability of future cash flows (Henisz et al., 2014).
Moreover, relative carbon performance can act as a credible signal to capital markets of a firm’s internal capabilities and strategic orientation (Spence, 1973). Because external observers often face information asymmetries about firms’ environmental management quality, measurable outperformance on carbon indicators vis-à-vis direct rivals communicates unobservable attributes such as superior managerial foresight, process efficiency, and risk management competence (Connelly et al., 2011). Such signals may be especially salient in settings of intense rivalry where investors are looking for differentiators between otherwise similar firms. This informational role can elevate analyst coverage, improve valuation multiples, and accelerate the incorporation of future benefits into current stock prices (Dhaliwal et al., 2012).
Furthermore, outperforming rivals in carbon management can both demonstrate and accumulate valuable organizational resources and capabilities (Barney, 1991). High relative carbon performance signals that a firm already possesses routines, data infrastructures, and stakeholder relationships that are difficult for competitors to imitate, while simultaneously deepening those capabilities through continued investment and learning (Hart, 1995; Hart and Milstein, 2003; Russo and Fouts, 1997). When such capabilities are honed in the context of direct competition, they become embedded in core operational and reputational competencies that underpin long-term competitive advantage. Thus, relative carbon leadership may not only enhance immediate legitimacy but also build hard-to-replicate resource positions that support sustained superior performance.
Hypothesis 1 (H1): A firm’s carbon performance relative to its direct competitors is positively associated with firm value.
2.2 Competitive Pressure as a Boundary Condition
Firms within the same competitive group face different levels of competitive pressure, influenced by factors such as firm size, market overlap, and technological capabilities. This pressure shapes both managerial priorities and external assessments of firm value (Aghion et al., 2005; Giroud and Mueller, 2011; Nickell, 1996). Rivalry often intensifies within groups defined by firm size, with stronger competition affecting firm performance outcomes (Mas-Ruiz and Ruiz-Moreno, 2011).
When competition is intense, managers tend to prioritize short-term survival and market share defense over initiatives with longer payback periods or higher uncertainty (Asker et al., 2015). This shift frequently results in price competition, aggressive cost-cutting, and defensive market positioning, which can crowd out long-term investments, including environmental initiatives (He and Tian, 2013). This dynamic is particularly pronounced in carbon reduction strategies, which demand substantial upfront capital, long investment horizons, and exposure to regulatory and market uncertainty. In highly competitive markets, these characteristics make such strategies especially vulnerable to resource diversion toward short-term tactics (Duanmu et al., 2018). Sustaining high-carbon-performance investments under these conditions can erode cost competitiveness, weaken survival prospects, and limit the ability to capture market premiums.
Competitive pressure also amplifies the agency mechanisms that drive managerial short-termism. When dismissal risk is high, and executive compensation is tied to quarterly earnings or stock returns, managers are more likely to favor projects with immediate and visible payoffs (Gryglewicz et al., 2020; Stein, 1989). Incentive contracts emphasizing easily measurable outcomes bias managerial effort toward short-term tasks and away from harder-to-measure, long-horizon initiatives such as environmental investments (Graham et al., 2006; Holmstrom and Milgrom, 1991).
Beyond managerial incentives, competition can also reorder institutional pressures. Firms undertake legitimacy-enhancing actions, such as environmental investments, in response to the institutional pressures (Di Maggio and Powell, 1983; Scott, 2008). Yet, when survival becomes salient and resources are constrained, firms may shift these institutional demands to a secondary position or adopt more symbolic forms of compliance (Delmas and Toffel, 2008; Oliver, 1991). At the same time, investors recalibrate their evaluations toward short-term profitability rather than other non-financial metrics, including carbon performance.
Taken together, these mechanisms imply that the positive valuation effect of superior carbon performance is likely to be weaker in highly competitive markets.
Hypothesis 2 (H2): Competitive pressure attenuates the positive association between a firm’s relative carbon performance and its firm value.
2.3 Aligning Non-market and Competitive Strategies
In competitive markets, the extent to which superior carbon performance is rewarded depends on whether non-market achievements reinforce competitive strategies that generate advantage. Competitive strategies are typically classified as cost leadership or differentiation (Porter, 1985). However, the relationship between carbon performance and cost leadership is not always straightforward. Emission reductions can yield cost savings through regulatory compliance, operational efficiencies, or lower capital costs, but these benefits often hinge on high and uncertain abatement costs, substantial upfront investments, and exposure to volatile carbon pricing regimes (Benkraiem et al., 2022; Venmans et al., 2020).
To realize stronger and more predictable returns, firms increasingly pursue differentiation strategies that embed carbon performance into value creation. Integrating carbon leadership into a differentiation strategy offers a more consistent and direct pathway to competitive advantage (Ambec and Lanoie, 2008). When effectively executed, carbon leadership can stimulate demand, enhance customer loyalty, and expand market share (Corb et al., 2023). Differentiation is frequently achieved through innovation, enabling firms to deliver unique, high-value solutions that reinforce their market position (Sutton, 1991).
A key enabler of this approach is green innovation, which strengthens firms’ ability to sense environmental shifts, seize opportunities in low-carbon markets, and reconfigure internal resources to develop new products, services, and business models (Kim et al., 2023; Teece et al., 1997). This capability transforms carbon performance from a compliance-oriented outcome into a platform for ongoing adaptation and market expansion. Green innovation thus becomes not merely a cost-saving measure but also a route to new product and market creation, for example, through low-carbon technologies, circular-economy business models, or premium eco-branded offerings (Hart and Dowell, 2011; Horbach, 2008; Klassen and Whybark, 1999).
Moreover, because carbon performance is often opaque and vulnerable to accusations of greenwashing, firms must demonstrate authenticity. Adopting advanced environmental technologies, issuing certified green bonds, or launching eco-designed products can serve as credible signals of long-term commitment to sustainability (Connelly et al., 2011; Flammer, 2021; Zerbib, 2019). Such visible, costly investments complement measurable carbon outcomes and reduce information asymmetry for stakeholders. This combination makes imitation by less-committed firms more difficult and enhances the market’s valuation of superior carbon performance.
Hypothesis 3 (H3): Differentiation achieved through green innovation strengthens the positive association between a firm’s relative carbon performance and its firm value.
Ⅲ. Methods
3.1 Data and Sample
This study focuses on measuring firms’ relative carbon performance within their specific competitive groups. Carbon emissions data, expressed as greenhouse gas (GHG) equivalents, were obtained from MSCI. These data include both voluntarily reported emissions and estimated emissions, the latter calculated using conversion factors based on energy consumption.
To capture the distinct competitive landscapes each firm faces, we employ the text-based network industry classification system for U.S.-listed firms developed by Hoberg and Phillips (2016). This method constructs a dynamic, firm-specific network in which companies are linked according to the similarity of their businesses. Similarity is assessed through textual analysis of the business descriptions in firms’ annual 10-K filings. The text is transformed into numerical word vectors, and cosine similarity scores are calculated for all firm pairs. A firm’s competitive group consists of all other firms whose pairwise similarity exceeds a prespecified minimum threshold. Rather than selecting this threshold arbitrarily, it is calibrated so that the fraction of firm pairs classified as being in the same group matches the proportion observed in traditional three-digit SIC industries, approximately 2.05% of all possible firm pairs. Applying this rule yields a minimum cosine similarity of roughly 21.3%, ensuring that the resulting groups have a density comparable to three-digit SIC industries while flexibly reflecting actual product-market overlaps. Because the classification is firm-centric, it does not impose transitivity: a firm can be in one company’s competitive group but not in another’s, even if those two companies are themselves linked.
The validity of this approach is supported by prior research showing that managers define competitors not strictly by objective industry structures but through cognitive categories (Porac et al., 1989). Such cognitive competitive groups reinforce behavioral motivation and strategic similarity. Reger and Huff (1993) further demonstrated the existence of cognitive strategic groups by applying textual analysis to corporate reports, showing that managerial language and communication patterns can reveal perceived competitive structures.
Unlike standard industry classifications, which overlook differences in rivalry among industry peers, the text-based network approach allows for firm-specific and evolving rival sets. The classification is updated annually, enabling each firm’s competitive group to change over time as corporate strategies, product offerings, and market participation evolve. This feature aligns with earlier findings that competitive group membership is not fixed but dynamically shifts in response to market and strategic developments (Fiegenbaum and Thomas, 1990). The final sample consists of 4,260 observations covering 1,023 U.S. firms over the period 2014–2021.
3.2 Variables and Analytical Model
The dependent variable in this study is firm value, measured by Tobin’s Q, which is calculated as the ratio of a firm’s market value of assets to the replacement cost of those assets. This metric reflects both current profitability and investors’ expectations of future growth and performance (Flammer et al., 2019; Kahle and Stulz, 2017). It is constructed using data from Compustat.
The key independent variable is relative carbon performance, which compares the focal firm’s carbon intensity to that of its competitive group. First, carbon intensity is calculated as Scope 1 and Scope 2 greenhouse gas emissions divided by total sales, following prior studies (Aswani et al., 2024; Benkraiem et al., 2022). This measure reflects the firm’s carbon footprint while adjusting for firm size, aligning with the societal goal of reducing emissions without sacrificing productivity. To address skewness, the natural logarithm of carbon intensity is used. The weighted average log carbon intensity of competitors is then calculated, where the weights capture rivalry between the focal firm and each competitor. Finally, the focal firm’s log carbon intensity is subtracted from this weighted average, producing a log difference equal to the log of the ratio between the firm’s carbon intensity and the competitive-group average. A positive value indicates that the focal firm’s carbon intensity is lower than its competitors', while a negative value indicates higher intensity.
Two moderating variables are considered. The first is the average business similarity score within the competitive group. A higher average similarity indicates greater competitive pressure, as competitors operate businesses more similar to that of the focal firm. Hoberg and Phillips (2016) found that firms with higher average similarity are more likely to disclose competitive pressures in the Management’s Discussion and Analysis section of their 10-K filings. The second is the innovation category score, a component of the environmental score from Refinitiv, which captures the firm’s capacity to create market opportunities through new environmental technologies, processes, and eco-designed products.
The model includes a set of control variables known to influence firm value. These include firm size, measured as the natural logarithm of total assets; profitability, measured as net income to total assets; leverage, measured as total liabilities to total assets; intangible asset intensity, measured as total intangible assets to total assets; and cash holdings, measured as cash and short-term investments to total assets. All financial variables are obtained from Compustat (Awaysheh et al., 2020; Flammer et al., 2019). Ratio variables are winsorized at the 1st and 99th percentiles to mitigate the influence of outliers. Additional controls include analyst following, measured as the number of analyst reports covering the firm from the I/B/E/S database, as well as governance and social pillar scores from MSCI, which capture firm-level practices related to corporate governance and social responsibility (e.g., board structure, governance quality, labor relations, and supply chain management) (Lang et al., 2004; Surroca et al., 2020). To account for firms’ strategic commitment to emissions reduction, we also include a carbon reduction target variable derived from the Carbon Disclosure Project (CDP), which reflects stated rather than realized reductions. Finally, following Sautner et al. (2023), we incorporate a measure of firm-level climate risk exposure based on the frequency of bigrams of climate-related and risk-related terms in earnings calls, capturing the extent to which firms are perceived as exposed to climate-related risks.
In our empirical specification, we employ lagged dependent and control variables to mitigate reverse causality. Firm fixed effects are included to control for unobserved, time-invariant heterogeneity across firms, and year fixed effects are added to capture economy-wide temporal shocks. Standard errors are clustered at the firm level to account for serial correlation within firms over time.
Ⅳ. Results
4.1 Main Results
Table 1 Descriptive statistics and correlations
| Variable | Mean | S.D. | 1 | 2 | 3 | 4 | 5 | 6 | 7 | 8 | 9 | 10 | 11 | 12 | 13 | 14 | |
|---|---|---|---|---|---|---|---|---|---|---|---|---|---|---|---|---|---|
| 1 | Tobin's Q | 2.66 | 2.12 | 1.00 | |||||||||||||
| 2 | Relative carbon performance | 0.00 | 1.21 | 0.05 | 1.00 | ||||||||||||
| 3 | Competitive pressure | 3.41 | 2.46 | 0.10 | 0.01 | 1.00 | |||||||||||
| 4 | Green innovation | 24.49 | 30.70 | -0.17 | -0.05 | -0.21 | 1.00 | ||||||||||
| 5 | Firm size | 8.26 | 1.75 | -0.32 | 0.02 | -0.13 | 0.41 | 1.00 | |||||||||
| 6 | Profitability | 0.74 | 14.16 | -0.12 | 0.06 | -0.36 | 0.20 | 0.38 | 1.00 | ||||||||
| 7 | Leverage | 57.64 | 23.94 | -0.07 | -0.01 | -0.02 | 0.08 | 0.27 | -0.12 | 1.00 | |||||||
| 8 | Intangible asset intensity | 23.39 | 21.92 | -0.09 | 0.00 | -0.25 | 0.04 | 0.14 | 0.18 | 0.05 | 1.00 | ||||||
| 9 | Cash holdings | 20.27 | 21.76 | 0.52 | 0.02 | 0.40 | -0.25 | -0.48 | -0.41 | -0.25 | -0.31 | 1.00 | |||||
| 10 | Analyst following | 6.33 | 4.40 | 0.04 | 0.03 | 0.01 | 0.17 | 0.50 | 0.11 | 0.04 | -0.03 | -0.04 | 1.00 | ||||
| 11 | Governance | 4.35 | 2.59 | 0.04 | -0.03 | -0.08 | 0.03 | -0.04 | 0.16 | -0.08 | 0.04 | -0.01 | -0.02 | 1.00 | |||
| 12 | Social responsibility | 3.54 | 2.17 | 0.08 | 0.00 | -0.05 | 0.02 | -0.02 | 0.12 | -0.08 | 0.07 | 0.03 | 0.01 | 0.62 | 1.00 | ||
| 13 | Carbon reduction target | 5.86 | 14.85 | -0.04 | -0.04 | -0.08 | 0.29 | 0.43 | 0.14 | 0.12 | 0.05 | -0.12 | 0.27 | -0.07 | -0.02 | 1.00 | |
| 14 | Exposure to climate-related risks | 0.33 | 1.15 | -0.09 | -0.04 | -0.04 | 0.15 | 0.10 | 0.01 | 0.03 | -0.10 | -0.12 | -0.03 | -0.04 | -0.06 | 0.12 | 1.00 |
Note: Pairwise correlation greater than 0.03 is statistically significant at the 5% level.
Table 2 Main results
| Model 1 | Model 2 | Model 3 | Model 4 | |
|---|---|---|---|---|
| Relative carbon performance | 0.054 | 0.135 | 0.016 | 0.099 |
| (0.062) | (0.003) | (0.648) | (0.042) | |
| Competitive pressure | 0.018 | 0.018 | ||
| (0.571) | (0.572) | |||
| Relative carbon performance $\times$ Competitive pressure | -0.028 | -0.026 | ||
| (0.066) | (0.082) | |||
| Differentiation | 0.000 | 0.000 | ||
| (0.928) | (0.962) | |||
| Relative carbon performance x Differentiation | 0.001 | 0.001 | ||
| (0.032) | (0.078) | |||
| Firm size | -0.445 | -0.443 | -0.445 | -0.444 |
| (0.000) | (0.000) | (0.000) | (0.000) | |
| Profitability | 0.008 | 0.008 | 0.008 | 0.008 |
| (0.054) | (0.057) | (0.057) | (0.059) | |
| Leverage | 0.008 | 0.008 | 0.008 | 0.007 |
| (0.100) | (0.099) | (0.102) | (0.101) | |
| Intangible asset intensity | -0.005 | -0.005 | -0.004 | -0.004 |
| (0.367) | (0.374) | (0.386) | (0.388) | |
| Cash holdings | 0.001 | 0.001 | 0.001 | 0.001 |
| (0.822) | (0.829) | (0.804) | (0.813) | |
| Analyst following | 0.006 | 0.005 | 0.006 | 0.005 |
| (0.598) | (0.612) | (0.586) | (0.603) | |
| Governance | 0.002 | 0.001 | 0.002 | 0.001 |
| (0.890) | (0.940) | (0.898) | (0.943) | |
| Social responsibility | 0.017 | 0.018 | 0.017 | 0.018 |
| (0.394) | (0.365) | (0.381) | (0.358) | |
| Carbon reduction target | 0.002 | 0.002 | 0.002 | 0.002 |
| (0.498) | (0.506) | (0.508) | (0.514) | |
| Exposure to climate-related risks | -0.019 | -0.019 | -0.018 | -0.018 |
| (0.119) | (0.121) | (0.127) | (0.127) | |
| Constant | 5.712 | 5.648 | 5.707 | 5.647 |
| (0.000) | (0.000) | (0.000) | (0.000) | |
| Firm fixed effects | Y | Y | Y | Y |
| Year fixed effects | Y | Y | Y | Y |
| Number of observations | 4,260 | 4,260 | 4,260 | 4,260 |
| Number of firms | 1,023 | 1,023 | 1,023 | 1,023 |
| $R^2$ | 0.049 | 0.052 | 0.050 | 0.052 |
Note: p-values are reported in parentheses.
In Model 2, the interaction between relative carbon performance and competitive pressure is negative and statistically significant ($\beta = -0.028, p = 0.066$), indicating that the performance benefits of superior carbon efficiency are weaker in strategic groups characterized by higher competitive pressure. This finding supports Hypothesis 2. Figure 1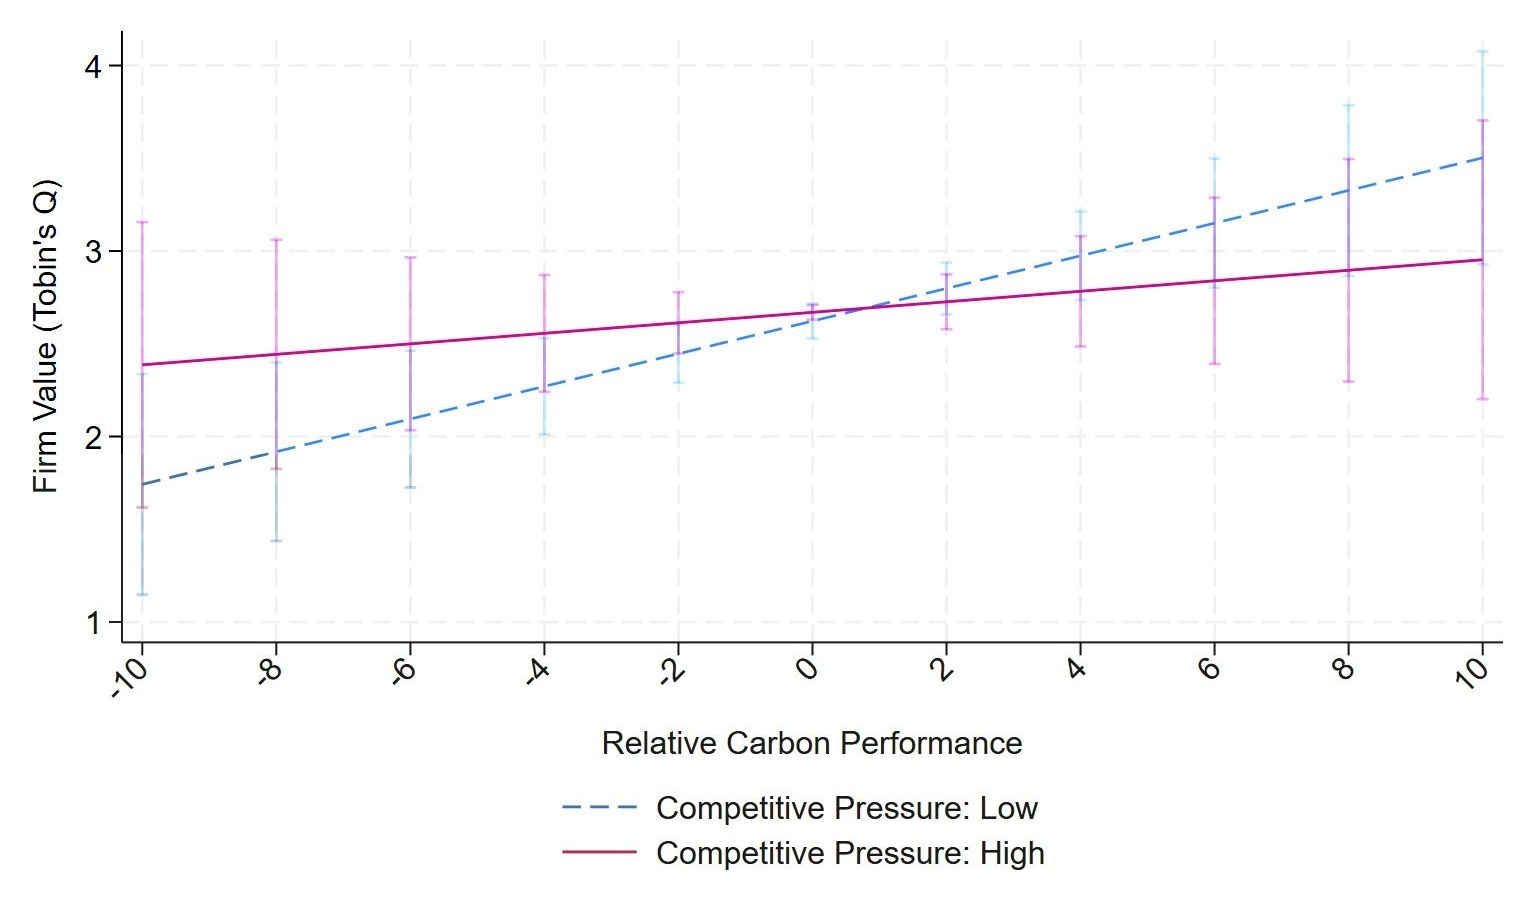
Model 3 tests Hypothesis 3 by incorporating the interaction between relative carbon performance and differentiation through green innovation. The interaction term is positive and significant ($\beta = 0.001, p = 0.032$), indicating that the market rewards for superior carbon performance are amplified when a firm differentiates its products and processes through green innovation. Figure 2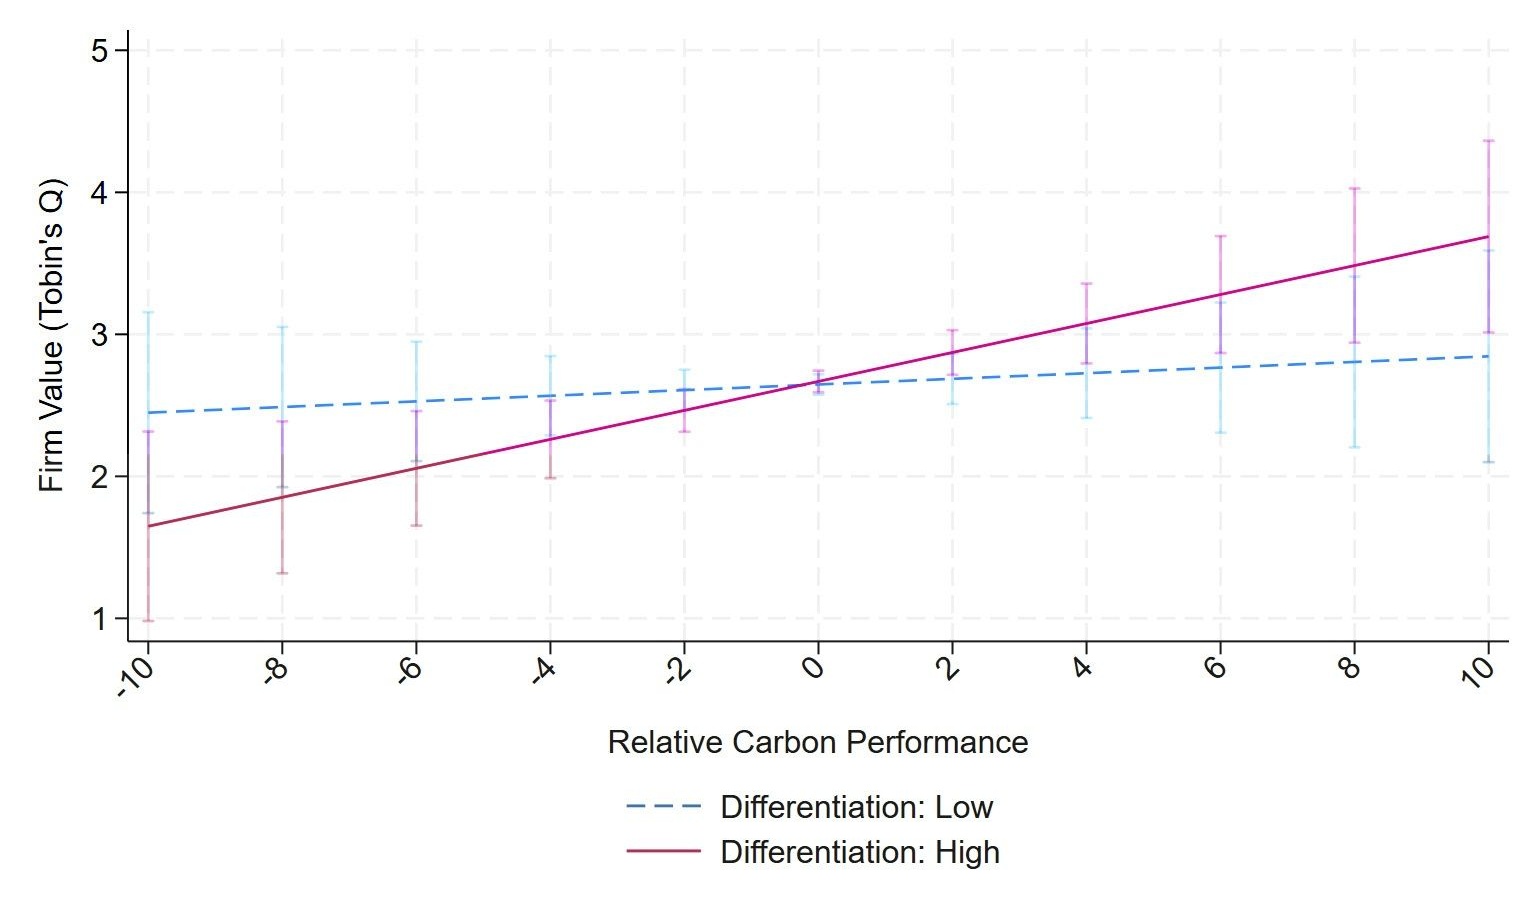
4.2 Robustness Tests
We conduct a series of robustness tests to validate our main findings. First, we re-estimate absolute carbon performance while controlling for three-digit industry-level effects and relative carbon performance within the industry group. To ensure interpretive consistency, we multiply the focal firm's carbon intensity by -1 (so that higher values indicate greater carbon efficiency). In Table 3
Table 3 Robustness test: Industry-level analysis
| Model 1 | Model 2 | |
|---|---|---|
| Carbon performance | 0.166 | |
| (0.000) | ||
| Relative carbon performance to industry peers | 0.134 | |
| (0.002) | ||
| Firm size | -0.292 | -0.291 |
| (0.000) | (0.000) | |
| Profitability | 0.008 | 0.008 |
| (0.150) | (0.146) | |
| Leverage | 0.008 | 0.008 |
| (0.002) | (0.001) | |
| Intangible asset intensity | -0.008 | -0.008 |
| (0.215) | (0.214) | |
| Cash holdings | 0.013 | 0.013 |
| (0.000) | (0.000) | |
| Analyst following | 0.026 | 0.026 |
| (0.025) | (0.024) | |
| Governance | 0.001 | 0.002 |
| (0.924) | (0.869) | |
| Social responsibility | 0.023 | 0.022 |
| (0.097) | (0.099) | |
| Carbon reduction target | 0.003 | 0.003 |
| (0.059) | (0.056) | |
| Exposure to climate-related risks | -0.010 | -0.011 |
| (0.436) | (0.399) | |
| Constant | 4.13 | 3.277 |
| (0.000) | (0.000) | |
| Industry fixed effects | Y | Y |
| Year fixed effects | Y | Y |
| Number of observations | 4,260 | 4,260 |
| Number of firms | 1,023 | 1,023 |
| $R^2$ | 0.04 | 0.038 |
Note: p-values are reported in parentheses.
We also examine relative carbon performance, calculated as the difference between the focal firm’s carbon intensity and the industry-average intensity. The coefficient for this measure is also larger than in the main analysis, indicating that the market’s apparent reward for carbon performance appears stronger when evaluated at the industry level. However, this inflation may reflect the presence of multiple strategic groups within an industry, some with consistently high carbon performance and high valuations, and others with low performance and low valuations. For example, grouping traditional automakers such as General Motors and Ford together with electric vehicle manufacturers like Tesla can produce an artificially steep association between carbon performance and valuation, especially in an era of heightened interest in green investing. Moreover, ESG rating providers such as MSCI(2022) and Bloomberg assess carbon management primarily at the industry level, and investors relying on these ratings may systematically reward industry leaders while penalizing laggards (Chatterji et al., 2009; MSCI, 2022). While informative, this approach may fail to capture the impact of non-market strategies that are often designed to confer advantage over direct competitors within a competitive group rather than over the industry as a whole.
Second, we refine the relative carbon performance measure by limiting the reference set to the five most similar competitors. While the text-based network industry classification provides similarity scores for all firm pairs with similar businesses, in practice, firms are more likely to monitor and respond strategically to their closest competitors rather than to all similar peers in the market. Restricting the calculation to the five nearest competitors better reflects actual competitive dynamics. As reported in Table 4
Table 4 Robustness test: Five competitors
| Model 1 | Model 2 | Model 3 | Model 4 | |
|---|---|---|---|---|
| Relative carbon performance | 0.054 | 0.132 | 0.022 | 0.101 |
| (0.051) | (0.002) | (0.505) | (0.025) | |
| Competitive pressure | 0.017 | 0.017 | ||
| (0.596) | (0.599) | |||
| Relative carbon performance $\times$ Competitive pressure | -0.027 | -0.025 | ||
| (0.051) | (0.064) | |||
| Differentiation | 0.000 | 0.000 | ||
| (0.908) | (0.925) | |||
| Relative carbon performance $\times$ Differentiation | 0.001 | 0.001 | ||
| (0.034) | (0.084) | |||
| Firm size | -0.447 | -0.448 | -0.446 | -0.448 |
| (0.000) | (0.000) | (0.000) | (0.000) | |
| Profitability | 0.008 | 0.008 | 0.008 | 0.008 |
| (0.055) | (0.056) | (0.057) | (0.058) | |
| Leverage | 0.008 | 0.007 | 0.008 | 0.007 |
| (0.100) | (0.103) | (0.102) | (0.104) | |
| Intangible asset intensity | -0.005 | -0.005 | -0.004 | -0.004 |
| (0.375) | (0.379) | (0.392) | (0.392) | |
| Cash holdings | 0.001 | 0.001 | 0.001 | 0.001 |
| (0.812) | (0.804) | (0.792) | (0.788) | |
| Analyst following | 0.006 | 0.006 | 0.006 | 0.006 |
| (0.579) | (0.601) | (0.568) | (0.590) | |
| Governance | 0.003 | 0.001 | 0.002 | 0.001 |
| (0.865) | (0.926) | (0.872) | (0.929) | |
| Social responsibility | 0.016 | 0.018 | 0.017 | 0.018 |
| (0.400) | (0.364) | (0.381) | (0.353) | |
| Carbon reduction target | 0.002 | 0.002 | 0.002 | 0.002 |
| (0.493) | (0.506) | (0.507) | (0.516) | |
| Exposure to climate-related risks | -0.018 | -0.018 | -0.018 | -0.018 |
| (0.122) | (0.124) | (0.125) | (0.126) | |
| Constant | 5.716 | 5.686 | 5.702 | 5.674 |
| (0.000) | (0.000) | (0.000) | (0.000) | |
| Firm fixed effects | Y | Y | Y | Y |
| Year fixed effects | Y | Y | Y | Y |
| Number of observations | 4,256 | 4,256 | 4,256 | 4,256 |
| Number of firms | 1,023 | 1,023 | 1,023 | 1,023 |
| $R^2$ | 0.049 | 0.052 | 0.050 | 0.053 |
Note: p-values are reported in parentheses.
Third, we examine whether advertising intensity moderates the relationship between relative carbon performance and firm value. Along with innovation, advertising is widely recognized as a differentiation mechanism, enabling firms to communicate the unique benefits of their products and services (Keller, 1993; Sutton, 1991). It can build brand equity, shape customer perceptions, and highlight a firm’s commitment to environmental practices (Aaker, 1989). Although advertising intensity is not necessarily targeted to carbon management, effective communication of a firm’s environmental efforts could magnify the valuation benefits of superior carbon performance. Consistent with this expectation, Table 5
Table 5 Robustness test: Advertising intensity
| Model 1 | Model 2 | Model 3 | |
|---|---|---|---|
| Relative carbon performance | 0.054 | 0.034 | 0.072 |
| (0.062) | (0.235) | (0.148) | |
| Advertising intensity | 0.009 | 0.008 | |
| (0.747) | (0.762) | ||
| Relative carbon performance $\times$ Advertising intensity | 0.013 | 0.013 | |
| (0.074) | (0.059) | ||
| Differentiation | 0.000 | ||
| (0.965) | |||
| Relative carbon performance $\times$ Differentiation | 0.001 | ||
| (0.052) | |||
| Competitive pressure | 0.019 | ||
| (0.561) | |||
| Relative carbon performance $\times$ Competitive pressure | -0.026 | ||
| (0.094) | |||
| Firm size | -0.445 | -0.436 | -0.434 |
| (0.000) | (0.000) | (0.000) | |
| Profitability | 0.008 | 0.008 | 0.008 |
| (0.054) | (0.055) | (0.060) | |
| Leverage | 0.008 | 0.008 | 0.007 |
| (0.100) | (0.099) | (0.101) | |
| Intangible asset intensity | -0.005 | -0.005 | -0.005 |
| (0.367) | (0.353) | (0.375) | |
| Cash holdings | 0.001 | 0.001 | 0.001 |
| (0.822) | (0.875) | (0.865) | |
| Analyst following | 0.006 | 0.005 | 0.005 |
| (0.598) | (0.616) | (0.623) | |
| Governance | 0.002 | 0.002 | 0.001 |
| (0.890) | (0.892) | (0.946) | |
| Social responsibility | 0.017 | 0.017 | 0.018 |
| (0.394) | (0.383) | (0.347) | |
| Carbon reduction target | 0.002 | 0.002 | 0.002 |
| (0.498) | (0.522) | (0.541) | |
| Exposure to climate-related risks | -0.019 | -0.018 | -0.018 |
| (0.119) | (0.126) | (0.136) | |
| Constant | 5.712 | 5.643 | 5.576 |
| (0.000) | (0.000) | (0.000) | |
| Firm fixed effects | Y | Y | Y |
| Year fixed effects | Y | Y | Y |
| Number of observations | 4,260 | 4,260 | 4,260 |
| Number of firms | 1,023 | 1,023 | 1,023 |
| $R^2$ | 0.049 | 0.050 | 0.053 |
Note: p-values are reported in parentheses.
As a fourth robustness check, we employ inverse probability weighting (IPW) based on propensity scores, since firms’ carbon strategies are not randomly distributed but may reflect industry-level conditions, such as regulatory pressure or social expectations, that also affect firm value. To mitigate such selection bias, we estimated propensity scores using a logit model of whether a firm belongs to an industry where carbon emissions are classified as a material issue in the MSCI ESG Industry Materiality Map, conditional on firm-level controls. The inverse of these estimated probabilities was then used to reweight the sample so that sample firms became more comparable in their observable characteristics. The results remain consistent with the baseline analysis. Relative carbon performance continues to show a positive and significant effect on firm value (Model 1: $\beta = 0.06$, $p = 0.021$), while its benefits are attenuated under higher competitive pressure (Model 2: $\beta = -0.026$, $p = 0.041$). At the same time, the moderating effect of green innovation remains positive and significant (Model 3: $\beta = 0.002$, $p = 0.002$), indicating that innovation-based differentiation consistently amplifies the value of superior carbon performance.
To further address concerns regarding temporal heterogeneity, we partition the sample into three sub-periods that reflect major shifts in the global climate policy and investment landscape: (i) 2014–2016, covering the growing awareness of climate change and the adoption of the Paris Agreement; (ii) 2017–2019, corresponding to the uncertainty following the U.S. withdrawal from the Paris Agreement; and (iii) 2020–2021, characterized by the COVID-19 pandemic and the rapid expansion of ESG investment. Figure 3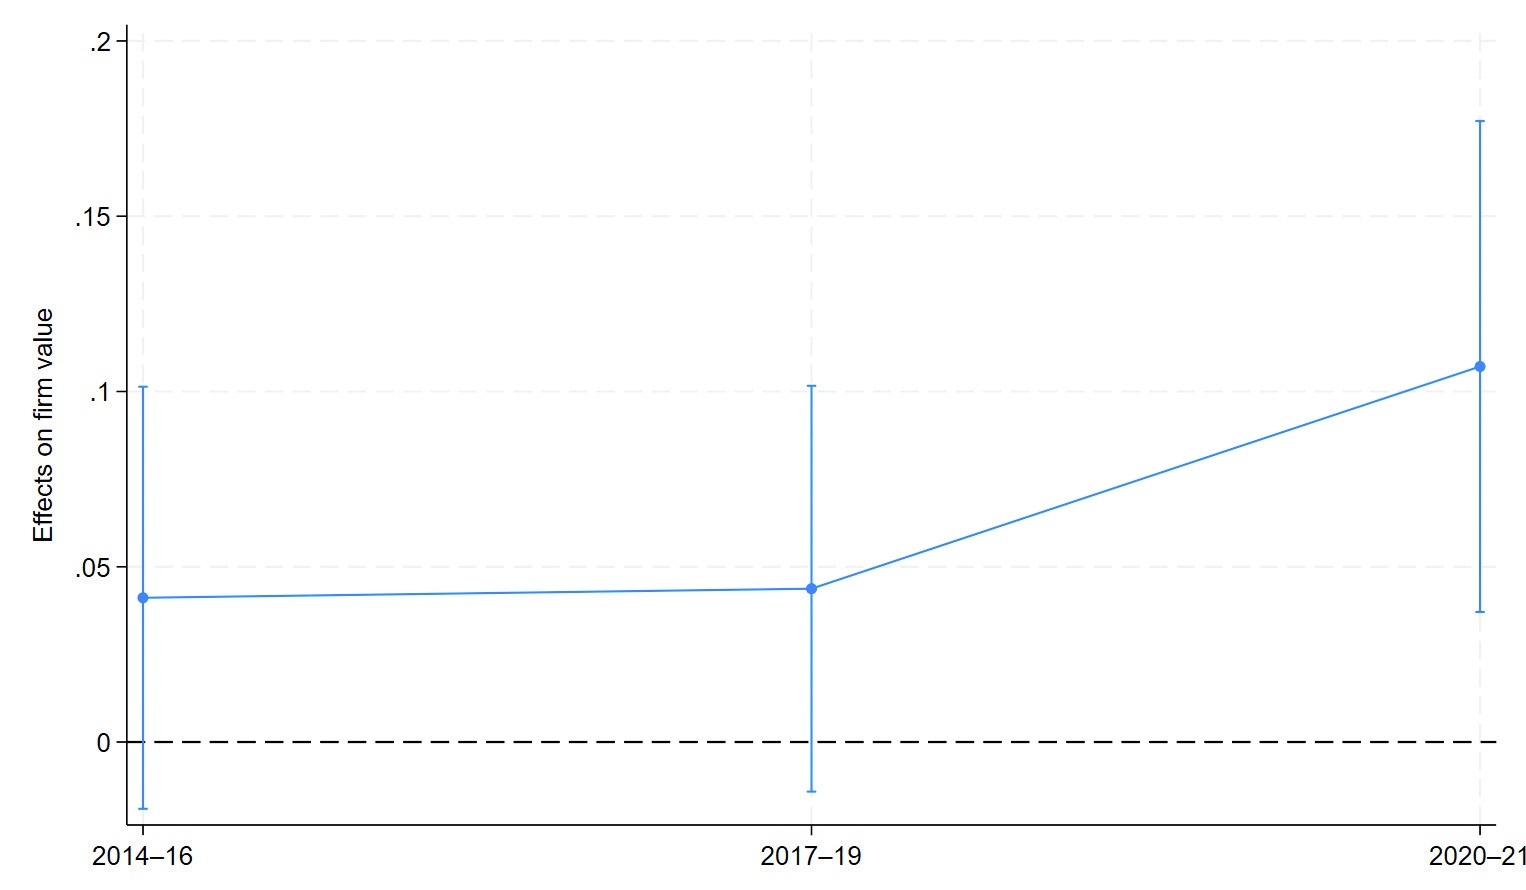
Ⅴ. Discussion and Conclusion
This study contributes to the literature on non-market strategy in several important ways. First, we extend prior research by explicitly incorporating the competitive context into the analysis. While existing studies often assess non-market actions against broad industry aggregates (Aswani et al., 2024; Benkraiem et al., 2022; Harjoto and Laksmana, 2018), we emphasize that firms pursue such strategies in reference to their direct rivals, seeking legitimacy and market opportunities relative to them. By considering clusters of firms whose actions and performance disproportionately affect one another, we show that rivalry intensity is critical in determining the impact of non-market initiatives on firm value. Although the importance of competitive groups is well established in the competitive strategy literature (Hunt, 1972; McGee and Thomas, 1986; Panagiotou, 2007; Porter, 1980), their role in shaping non-market behavior has rarely been examined. Because managers benchmark performance against salient rivals rather than industry-wide peers in non-market domains as well, the competitive context provides a more precise and practically relevant lens for evaluating the strategic value of non-market efforts. In line with calls for greater contextualization and refined measurement in non-market strategy research (George et al., 2016; Mellahi et al., 2016), our findings underscore the importance of embedding competitive dynamics into analyses of environmental initiatives.
We also integrate non-market and competitive strategy perspectives to clarify the mechanisms linking environmental initiatives to market value. Our findings indicate that aligning superior carbon performance with a differentiation strategy yields higher firm valuations. While carbon performance is widely recognized as a valuable non-market strategy (Busch and Lewandowski, 2018; Cao et al., 2019), its competitive pathways have received comparatively little attention. We argue that differentiation achieved through green innovation and targeted market communication provides a robust channel for enhancing firm value, as it signals distinctive capabilities and resonates with stakeholders who prioritize environmental leadership. By contrast, cost leadership based on superior carbon performance is a less reliable path to value creation, given the uncertain costs of carbon abatement, the substantial upfront investments required, and the volatility of carbon pricing regimes.
This study offers several managerial implications. First, our findings highlight the value of benchmarking carbon management efforts against direct strategic peers rather than broad industry aggregates. Assessing performance relative to this immediate rivalry group provides a more precise view of how environmental initiatives translate into competitive advantage. Managers should also recognize that the returns to carbon performance depend on competitive pressure. In highly competitive markets, long-term, resource-intensive environmental investments may be undervalued by investors focused on short-term results. This underscores the importance of carefully timing, sequencing, and allocating resources for carbon initiatives, particularly when immediate financial performance takes precedence over sustainability commitments.
Finally, to maximize market impact, firms should align environmental initiatives with their competitive strategy. Integrating carbon management with a differentiation approach, through visible green innovation and effective stakeholder communication, can enhance perceived uniqueness and market value. Merely meeting expectations by adopting cleaner energy sources or improving production efficiency may be insufficient unless positioned as part of a distinctive, value-creating offering.
5.1 Theoretical and Managerial Implications
This study contributes to the literature on non-market strategy in several important ways. First, we extend prior research by explicitly incorporating the competitive context into the analysis. While existing studies often assess non-market actions against broad industry aggregates (Aswani et al., 2024; Benkraiem et al., 2022; Harjoto and Laksmana, 2018), we emphasize that firms pursue such strategies in reference to their direct rivals, seeking legitimacy and market opportunities relative to them. By considering clusters of firms whose actions and performance disproportionately affect one another, we show that rivalry intensity is critical in determining the impact of non-market initiatives on firm value. Although the importance of competitive groups is well established in the competitive strategy literature (Hunt, 1972; McGee and Thomas, 1986; Panagiotou, 2007; Porter, 1980), their role in shaping non-market behavior has rarely been examined. Because managers benchmark performance against salient rivals rather than industry-wide peers in non-market domains as well, the competitive context provides a more precise and practically relevant lens for evaluating the strategic value of non-market efforts. In line with calls for greater contextualization and refined measurement in non-market strategy research (George et al., 2016; Mellahi et al., 2016), our findings underscore the importance of embedding competitive dynamics into analyses of environmental initiatives.
We also integrate non-market and competitive strategy perspectives to clarify the mechanisms linking environmental initiatives to market value. Our findings indicate that aligning superior carbon performance with a differentiation strategy yields higher firm valuations. While carbon performance is widely recognized as a valuable non-market strategy (Busch and Lewandowski, 2018; Cao et al., 2019), its competitive pathways have received comparatively little attention. We argue that differentiation achieved through green innovation and targeted market communication provides a robust channel for enhancing firm value, as it signals distinctive capabilities and resonates with stakeholders who prioritize environmental leadership. By contrast, cost leadership based on superior carbon performance is a less reliable path to value creation, given the uncertain costs of carbon abatement, the substantial upfront investments required, and the volatility of carbon pricing regimes.
This study offers several managerial implications. First, our findings highlight the value of benchmarking carbon management efforts against direct strategic peers rather than broad industry aggregates. Assessing performance relative to this immediate rivalry group provides a more precise view of how environmental initiatives translate into competitive advantage. Managers should also recognize that the returns to carbon performance depend on competitive pressure. In highly competitive markets, long-term, resource-intensive environmental investments may be undervalued by investors focused on short-term results. This underscores the importance of carefully timing, sequencing, and allocating resources for carbon initiatives, particularly when immediate financial performance takes precedence over sustainability commitments.
Finally, to maximize market impact, firms should align environmental initiatives with their competitive strategy. Integrating carbon management with a differentiation approach, through visible green innovation and effective stakeholder communication, can enhance perceived uniqueness and market value. Merely meeting expectations by adopting cleaner energy sources or improving production efficiency may be insufficient unless positioned as part of a distinctive, value-creating offering.
5.2 Limitations and Future Research
While our study offers valuable implications, several limitations create opportunities for future research. First, the empirical analysis focuses exclusively on U.S. publicly listed firms due to the data coverage of the text-based network industry classification system used to identify competitive relationships. This scope ensures data comparability and regulatory consistency, but overlooks the fact that many U.S. firms compete directly with international rivals in increasingly integrated global markets. Excluding foreign competitors may yield incomplete measures of relative carbon performance, particularly in sectors with intense cross-border rivalry. Moreover, carbon regulation intensity, enforcement capacity, and public climate awareness vary widely across jurisdictions, shaping both firms’ incentives to reduce emissions and the market’s valuation of such efforts. Future research could adopt a multi-country approach to incorporate a more comprehensive competitive context and account for diverse non-market conditions.
Second, our analysis is set in a period when climate change has been a prominent “grand challenge,” yet recent geopolitical and economic shifts suggest that pressures for corporate carbon reduction are far from static. Rising geopolitical tensions, heightened energy security concerns, and economic headwinds have, in some contexts, weakened the influence of international climate initiatives and delayed the adoption of more stringent carbon regulations (Canon et al., 2025; Nixon, 2025). If non-market pressures decline, the strategic salience of carbon performance may diminish, altering its effects on firm value and other market outcomes. Longitudinal research could explore how changes in the non-market environment, both toward tighter and toward looser carbon-related pressures, moderate the returns to carbon leadership in competitive contexts.
Third, while our measure of competitive context advances beyond coarse industry classifications by using strategically defined peer groups, it does not fully capture the multidimensional nature of rivalry dynamics (Chen, 1996; Chen et al., 2007). Factors such as mutual dependence, awareness, and capability asymmetries among competitors, as well as the frequency or type of non-market actions, may influence how relative non-market outcomes affect market valuation. Incorporating these dimensions in future research would deepen our understanding of how competitive interactions shape the strategic value of non-market initiatives.
Fourth, our focus on firm value as the primary outcome emphasizes investor expectations but may understate other important consequences of carbon performance in competitive contexts. Non-financial outcomes, such as stakeholder trust, supply chain resilience, and regulatory bargaining power, can be particularly valuable in periods of crisis or disruption (Lins et al., 2017). Extending the analysis to include these broader outcomes would provide a more holistic view of the payoffs to non-market strategies when examined through a competitive lens.
Fifth, our measure of carbon intensity is limited by its exclusion of Scope 3 emissions. Although Scope 1 and Scope 2 emissions provide a standardized and comparable basis across firms, Scope 3 emissions often account for the largest share of a company’s total carbon footprint, particularly in industries with extensive upstream and downstream value chains. Omitting these indirect emissions may understate the true variability in firms’ carbon performance and could bias the assessment of competitive differences in carbon strategies. Future research would benefit from incorporating comprehensive carbon measures that include Scope 3 emissions to capture more fully the environmental footprint and to evaluate how firms manage and signal performance across their entire supply chains.
Sixth, our study is subject to limitations in the measurement of carbon performance itself. ESG rating agencies such as MSCI, CDP, and LSEG rely heavily on firms’ self-reported or estimated emissions data, which raises concerns of greenwashing. Improvements in reported carbon performance may sometimes reflect disclosure practices or reporting boundaries rather than actual reductions. Relatedly, ESG ratings may embed a halo effect from social and governance practices, making it difficult to isolate the effect of environmental performance alone. Although we attempt to mitigate these concerns by including additional ESG sub-indices as controls, the possibility of residual confounding cannot be ruled out.
Seventh, although we employed firm and year fixed effects to account for time-invariant heterogeneity and common shocks, our design does not fully resolve endogeneity concerns. Independent and control variables were included in lagged form to partially mitigate simultaneity, yet this approach cannot rule out reverse causality or omitted variable bias. More rigorous identification strategies, such as instrumental variables (IV) or difference-in-differences designs, were not feasible with the available data. Accordingly, our results should be interpreted as associational rather than strictly causal. Nevertheless, by combining lagged covariates, extensive firm-level controls, and propensity score weighting, we aimed to reduce the most salient sources of bias and provide more credible evidence within the limits of observational data.
Table 6 Robustness test: Inverse probability weighting
| Model 1 | Model 2 | Model 3 | Model 4 | |
|---|---|---|---|---|
| Relative carbon performance | 0.06 | 0.138 | 0.013 | 0.089 |
| (0.021) | (0.001) | (0.697) | (0.054) | |
| Competitive pressure | 0.001 | 0.001 | ||
| (0.975) | (0.964) | |||
| Relative carbon performance $\times$ Competitive pressure | -0.026 | -0.023 | ||
| (0.041) | (0.062) | |||
| Differentiation | 0.001 | 0.000 | ||
| (0.711) | (0.748) | |||
| Relative carbon performance $\times$ Differentiation | 0.002 | 0.002 | ||
| (0.002) | (0.006) | |||
| Firm size | -0.352 | -0.348 | -0.351 | -0.347 |
| (0.001) | (0.001) | (0.001) | (0.001) | |
| Profitability | 0.011 | 0.011 | 0.011 | 0.011 |
| (0.006) | (0.006) | (0.006) | (0.007) | |
| Leverage | 0.007 | 0.007 | 0.007 | 0.006 |
| (0.075) | (0.077) | (0.078) | (0.080) | |
| Intangible asset intensity | -0.011 | -0.011 | -0.01 | -0.01 |
| (0.034) | (0.035) | (0.038) | (0.038) | |
| Cash holdings | -0.003 | -0.003 | -0.002 | -0.002 |
| (0.634) | (0.626) | (0.666) | (0.653) | |
| Analyst following | 0.005 | 0.005 | 0.005 | 0.005 |
| (0.607) | (0.603) | (0.586) | (0.586) | |
| Governance | 0.001 | -0.000 | 0.001 | 0.000 |
| (0.971) | (0.994) | (0.953) | (0.987) | |
| Social responsibility | 0.011 | 0.012 | 0.011 | 0.012 |
| (0.581) | (0.545) | (0.573) | (0.542) | |
| Carbon reduction target | 0.002 | 0.002 | 0.002 | 0.002 |
| (0.364) | (0.372) | (0.380) | (0.385) | |
| Exposure to climate-related risks | -0.02 | -0.020 | -0.019 | -0.019 |
| (0.098) | (0.104) | (0.120) | (0.123) | |
| Constant | 5.536 | 5.502 | 5.503 | 5.477 |
| (0.000) | (0.000) | (0.000) | (0.000) | |
| Firm fixed effects | Y | Y | Y | Y |
| Year fixed effects | Y | Y | Y | Y |
| Number of observations | 3,869 | 3,869 | 3,869 | 3,869 |
| Number of firms | 802 | 802 | 802 | 802 |
| $R^2$ | 0.023 | 0.026 | 0.025 | 0.027 |
Note: p-values are reported in parentheses.