.jpeg)
The Goldilocks Zone of Design: Optimizing Visual Complexity for Character Design Market Success
1 Konkuk University
2 Korea Advanced Institute of Science and Technology (KAIST)
DOI: https://doi.org/10.17287/kmr.2026.55.1.313
Abstract
This study examines how the visual complexity in character design influences consumer preference and marketability in South Korea. As character designs increasingly serve as standalone commercial products, understanding the role of visual complexity has become essential for both creators and firms. By combining machine learning-based image analysis with consumer surveys, we extract key visual attributes and corresponding psychological responses to character designs. Using linear regression models, we find an inverted U-shaped relationship between visual complexity and both consumer preference and marketability, indicating that moderate levels of complexity yield the most favorable responses and the highest commercial potential. Additionally, character designs characterized by strong contrast, clear edges, and distinctive structures are more likely to succeed in the marketplace. By integrating perspectives from aesthetics, marketing theory, and computational analysis, this research provides novel insights into character design strategies and highlights the potential of generative AI and visual feature engineering in advancing content commercialization.
Ⅰ. Introduction
The entertainment industry has seen a remarkable expansion in the commercialization and global influence of character designs (Kim and Na, 2011). Once limited to animation, comics, and gaming, character-driven brands now play a central role across industries, shaping consumer engagement through both cultural storytelling and commercial applications. Character designs function as both marketable products and strategic marketing tools, extending their reach into merchandise, digital platforms, and brand collaborations. Their growing significance highlights the evolving nature of content-driven commerce, where visual identity influences brand equity and consumer loyalty.
Digitalization has further accelerated this trend, as firms integrate character-based assets into transmedia strategies, interactive marketing, and branded merchandise to engage global audiences. Scholars have noted their role in enhancing brand recognition and fostering emotional connections with consumers (Pinho et al., 2023). Their economic impact is substantial: global retail sales of licensed merchandise reached $272 billion in 2016, with entertainment-and character-related properties accounting for nearly half of this figure (Licensing International, 2017).
Character designs have traditionally been developed to express and reinforce brand identity (Garretson and Niedrich, 2004). However, with the explosive growth of the IP industry, they are increasingly functioning as standalone products with independent revenue streams (Siegel and Wright, 2007; Yoong Hon, 2024). For example, the “Line Friends” characters Brown and Cony, originally developed to represent the mobile messenger platform Line, have evolved into standalone commercial entities. Their merchandise sales, ranging from plush dolls to household goods, are driven less by their association with Line and more by the characters’ own appeal. Another example is characters such as Hello Kitty and My Melody from Sanrio, whose commercial success is largely driven by their standalone appeal. These characters are frequently used in collaborative products to promote other brands, appearing across diverse product categories.
Despite the widespread use of characters in marketing, systematic investigation into the determinants of character design marketability remains limited. Most branding research treats characters as intangible assets that bolster corporate identity, offering little insight into when and why characters succeed as physical or digital products in the marketplace. As character IPs increasingly function as independent commercial entities, it becomes essential to shift the analytical lens from “brand spokes-character” to “standalone product.” This study addresses that gap by examining the visual factors that contribute to a character’s market appeal, using quantitative methods to identify design elements that influence consumer behavior. By doing so, it provides a theoretical and empirical framework for understanding how character designs operate at the intersection of symbolic representation and economic performance, where aesthetic choices are not only expressive but also strategically consequential.
Visual complexity—a measure of the number and arrangement of visual elements in a design—has long been debated in product design and branding literatures. Some studies find that higher complexity enhances novelty and differentiation, thereby increasing consumer attention and perceived value (Creusen et al., 2010; Clement et al., 2013; Donato and Adıgüzel, 2022). In contrast, other work argues that excessive complexity can overwhelm cognitive processing, reduce aesthetic preference, and hinder purchase intent (Pieters et al., 2010; Overgoor et al., 2022). To date, these perspectives remain at odds, and few models specify the conditions under which complexity transitions from beneficial to detrimental. This theoretical ambiguity highlights the necessity of an "optimal complexity" framework: one that identifies the level of visual intricacy at which character designs maximize both appeal and commercial viability. Yet, existing research has neither operationalized this concept in the context of character products nor tested its implications empirically. Building on this gap, our study treats characters as standalone products governed by product design principles—price sensitivity, collectibility, and purchase intent—rather than solely as brand extensions. We thus investigate how varying degrees of visual complexity influence consumer preference and expected marketability when characters are positioned and evaluated as purchasable items.
Iconic characters often strike a careful balance between simplicity and complexity. For instance, in Studio Ghibli's My Neighbor Totoro, Totoro's design employs a smooth, rounded silhouette and a restrained grayscale palette, while strategic details—such as the subtle linework indicating fur texture on his belly and the pronounced contrast of his large, expressive eyes—introduce just enough intricacy to enhance both approachability and a sense of magical wonder. Likewise, research on 3D animation characters demonstrates that adjustments to facial feature proportions—such as exaggerated mouth-to-face distances—enhance perceived believability and emotional engagement (Chen et al., 2020). These cases illustrate the importance of optimizing visual complexity to maximize marketability.
In this study, we define visual complexity within the character design context, establish quantitative measurement indicators for its assessment, and examine its impact on expected marketability and consumer preference. Additionally, we investigate factors affecting actual commercialization decisions beyond consumer perceptions using a logistic regression model.
The remainder of this paper is structured as follows. First, we review relevant literature on character design marketability, dual-function theory, and product-oriented design hypotheses. Next, we outline the survey methodology used to assess perceptions of character design images, describe the operationalization of complexity variables, and present our modeling approach. We then employ regression models to explore how visual complexity influences consumer preference and expected marketability, and logistic regression to explore factors affecting actual commercialization decisions. Finally, we discuss our findings’ theoretical contributions and practical implications, and conclude with recommendations for future research.
Ⅱ. Conceptual background and hypotheses
2.1 Character design and psychological responses
Character design in commercial contexts represents a complex interdisciplinary field integrating aesthetic principles, technological applications, and cultural frameworks to develop engaging entities across various media platforms (Miketić et al., 2018). In psychology, the term “character” has traditionally referred to internal personality traits and one’s relationship with the external world (Baudry, 1984), whereas in storytelling or data visualization, character refers to the identifiable agents that guide narrative understanding (Dasu et al., 2023). In design research, related concepts such as design frames are often ambiguously defined and context-dependent, requiring greater conceptual clarity to develop coherent cognitive models (Kelly and Gero, 2022). These varying definitions underscore the need to precisely define the notion of “character” within a given research context. In this study, we define a character as a visually rendered, anthropomorphic entity designed with the intention of eliciting user engagement and potential market appeal (Li et al., 2025). This definition excludes utilitarian avatars used for user representation (e.g., in games or metaverse environments), non-anthropomorphic mascots, and characters embedded exclusively within linear media narratives (e.g., film protagonists). Instead, we focus on characters that are visually self-contained and possess the potential to function as standalone commercial products, such as figurines, character-branded merchandise, and collectible digital assets. In doing so, our scope aligns with the character merchandising industry, in which visual design alone, rather than embedded narrative or interactive role-forms the primary basis of consumer engagement and valuation.
Within the domain of three-dimensional animation, character design occupies a central position in the production pipeline, with particular emphasis on developing distinctive stylistic approaches that embody specific cultural signifiers (Wu and Chang, 2021). In particular, marketing and advertising literature has extensively explored the effects of spokes-characters. These studies suggest that characters can significantly influence consumer responses, including perceived trustworthiness (Garretson and Niedrich, 2004), likability (Phillips and Lee, 2005; Chang, 2014), and purchase intent by fostering positive brand attitudes (Chang, 2014). Consequently, spokes-characters play a crucial role in shaping brand identity and fostering consumer-brand relationships (Callcott and Lee, 1995).
Psychological responses to character designs encompass both cognitive and affective components, which, while distinct, are interrelated and often occur simultaneously (Bitner, 1992). Cognitive responses involve rational information processing, such as evaluating a character’s sincerity, trustworthiness, and competence (Folse et al., 2012; Danovitch and Mills, 2014). These evaluations are particularly influential in building trust between consumers and brands (Garretson and Burton, 2005). In contrast, affective responses include emotional reactions such as sympathy, empathy, and emotional alignment with a character’s traits or experiences (Hoorn and Konijn, 2003; Schramm and Knoll, 2015; Park et al., 2019). These emotional connections enhance brand loyalty (Mac Innis and Folkes, 2017). Therefore, thoughtful character design and authentic representation are crucial in shaping consumer perceptions, fostering emotional engagement, and aligning with brand values.
Consumer perceptions of a character’s authenticity, originality, and relatability strongly influence their willingness to purchase branded products (Aaker, 1997; Kim, 2011). However, most prior studies have concentrated on characters as tools for enhancing corporate branding and advertising effectiveness rather than the characters themselves as marketable products. This emphasis overlooks a critical distinction: characters can function not only as branding instruments but also as standalone consumer goods, particularly in industries such as animation, games, and merchandise. Few studies have investigated how intrinsic design attributes, such as visual complexity, affect the commercial viability of characters as products in their own right. Our study addresses this gap by shifting the analytical focus from characters as peripheral branding elements to their central role as product offerings. By doing so, we aim to investigate how psychological responses toward a character design influence user-side evaluations, such as preference and expected marketability.
It is important to clarify that ‘expected marketability’ in this study refers to consumers’ perceived potential of a character design to succeed in the marketplace, based on subjective evaluations collected through surveys, rather than actual commercialization decisions made by producers or firms. While actual market performance involves a complex set of strategic and operational factors, our focus remains on how design features and psychological responses contribute to the perceived market potential of characters from the consumer's perspective. In particular, we propose that visual complexity plays a pivotal role in shaping both preference and expected marketability, thereby contributing to the literature on design aesthetics and consumer behavior, and offering practical implications for character commercialization strategies.
2.2 Visual complexity in character design
Visual complexity has been conceptualized through various frameworks. Prior studies have measured it based on factors such as the number of visible objects, degree of irregularity, level of detail, object dissimilarity, and asymmetry in arrangement (Orth and Crouch, 2014). The theory of visual complexity (Attneave, 1954; Donderi, 2006) suggests that images contain redundancy—non-randomness of visual information, including similarity, proximity, and continuity of features—where lower redundancy corresponds to higher complexity. In general visual stimuli, increased complexity can heighten arousal, attract attention, and improve memorability through peripheral processing (Petty and Cacioppo, 1986; Deng et al., 2009), but may also impose cognitive load and reduce clarity (Pieters et al., 2010).
Research in aesthetic preferences more broadly has similarly demonstrated that stimulus complexity follows an inverted-U relationship—where preference increases with complexity up to an optimal point, after which it declines (Delplanque et al., 2019). Empirical studies in visual art and music further validate this pattern (Chmiel and Schubert, 2017; Gordon and Gridley, 2013; Hekkert and Van Wieringen, 1990; Madison and Schiölde, 2017; Marin et al., 2016; Messinger, 1998). Advertisements typically combine multiple visual elements—such as products, brand logos, backgrounds, models, and text—to establish brand positioning and enhance appeal (Alden et al., 1999; Liu et al., 2020). Prior research has shown that the quantity, regularity, symmetry, and arrangement of these elements significantly affect consumer perception and behavior (Cox and Cox, 2002; Donderi, 2006; Peracchio and Meyers-Levy, 1994, 2005; Favier et al., 2019; Tong et al., 2022). This principle has made visual complexity a key characteristic in advertising research, particularly regarding its influence on consumer attitudes (Pieters et al., 2010; Wu et al., 2016; Kusumasondjaja and Tjiptono, 2019; Baek et al., 2023; Pleyers, 2024). This principle suggests that character designs must balance simplicity and complexity to maximize appeal while avoiding excessive detail that overwhelms consumers (Hekkert and Van Wieringen, 1990). However,a direct application of these findings to character designs is not straightforward.
In the context of character design, a single, anthropomorphic visual object imbued with narrative and emotional cues, these mechanisms interact with additional processes such as emotional resonance, narrative identification, and anthropomorphism (Epley et al., 2007; Horton and Wohl, 1956). For example, when a character’s form becomes too intricate, viewers may struggle to interpret facial expressions or attribute personality traits quickly, whereas moderate complexity can enhance perceived richness and foster parasocial engagement. In contrast to advertisements—where overall design composition matters—a character’s color scheme, edge definition, and texture complexity are more central in shaping consumer perception (Pieters et al., 2010; Wedel and Pieters, 2014; Xiao and Ding, 2014). The concept of feature complexity refers to the variation and richness of pixel-level visual information that the human visual system processes at an early stage (Palmer, 1999). This includes unstructured and low-level features of the image, independent of any semantic or narrative content. In character images, higher levels of color diversity, edge density (or the standard deviation of edge strength), and texture variation contribute to a greater sense of feature complexity.
Each of these complexity dimensions is expected to evoke distinct psychological responses. Specifically, color complexity may stimulate visual curiosity and promote cognitive engagement by increasing visual search and processing effort (Huhmann, 2003; Ales et al., 2020; Sun and Firestone, 2021; Kanuri et al., 2024), whereas edge complexity can influence the perceived sharpness and clarity of a character’s form, impacting the ease of recognition and emotional expressiveness (Queiroz et al., 2014; Kendall et al., 2016; del Valle-Canencia et al., 2022; Sunstrum et al., 2024). Texture complexity may enrich sensory detail and drive emotional engagement by conveying material qualities or symbolic associations (Whitaker et al., 2008; Djonov and Van Leeuwen, 2011; Jacobs et al., 2016). These cognitive (e.g., attention, processing fluency) and emotional (e.g., affective resonance, visual pleasure) responses serve as essential determinants of outcomes such as preference and perceived marketability. Accordingly, we conceptualize a pathway in which each type of complexity activates specific psychological reactions, which then influence consumer behavior. However, when feature complexity is too high, it can hinder a viewer’s ability to interpret or emotionally connect with the character quickly. Excessive visual detail may distract from the core identity or emotional expression of the character, reducing clarity and engagement (Pieters et al., 2010). Important visual cues, such as facial features, silhouettes, or symbolic elements, may become obscured by unnecessary visual noise. On the other hand, a moderate level of feature complexity can act as a positive peripheral cue, enhancing visual interest, stimulating arousal, and improving memorability (Deng et al., 2009).
The Elaboration Likelihood Model (Petty and Cacioppo, 1986; Lee and Yoon, 2025; hereafter, ELM) provides a relevant framework, as visual complexity, through dimensions such as color, edge, and texture, can act as peripheral cues. These cues attract attention and shape consumer attitudes without requiring detailed cognitive elaboration. Rather than conveying explicit arguments, character visuals often function as aesthetic or affective signals that influence user preference through visual appeal, perceived quality, or emotional resonance. Therefore, applying the ELM framework is justified when character exposure occurs under low motivation, low involvement, or passive viewing conditions (e.g., social media, mobile search, physical shelf), which are common across both digital and physical touchpoints (Shin et al., 2020). This is particularly evident in low-motivation environments, such as social media or mobile platforms, where users scroll quickly and have limited capacity for in-depth processing. In such contexts, character design functions within a low elaboration setting, in which consumers are unlikely to engage in central-route processing of product information. Even in offline settings, such as when consumers encounter characters through merchandise, packaging, or figurine displays, character design is often processed spontaneously and visually rather than analytically. However, character images with too little complexity may fail to capture interest or stand out from competing content, while those with excessive complexity may overwhelm viewers and impair recognition. This supports a non-linear, inverted-U-shaped relationship between feature complexity and viewer preference (Morrison and Dainoff, 1972). Also, drawing on the processing fluency framework, the visual complexity of character images is hypothesized to exhibit an inverted-U relationship with consumer preference (Berlyne, 1973; Reber et al., 2004): low to moderate complexity (i.e., low to moderate cognitive load) enhances processing fluency and aesthetic pleasure, while excessive complexity (i.e., high cognitive load) reduces fluency, consequently diminishing perceived beauty and preference.
Existing research has not adequately addressed how visual complexity functions within character design as a standalone feature, nor has it empirically examined its influence on perceived marketability. Furthermore, most studies rely on subjective evaluations rather than objective image-based indicators.
This study addresses these gaps by applying quantifiable measures of visual complexity to character images and analyzing their relationship with consumer preference and marketability. Building on these insights, this study defines visual complexity in character design across three key dimensions, color, edges, and texture (Kaur and Sohi, 2016; Pavithra and Sharmila, 2018; Overgoor et al., 2022). These dimensions capture the essential visual attributes that shape consumer perception and preference. Based on this foundation, we propose the following hypotheses:
Hypothesis 1a (H1a): The color complexity of the character design images has an inverted-U relationship with consumer preference.
Hypothesis 1b (H1b): The color complexity of the character design images has an inverted-U relationship with the expected marketability of merchandised goods.
Hypothesis 2a (H2a): The edge complexity of the character design images has an inverted-U relationship with consumer preference.
Hypothesis 2b (H2b): The edge complexity of the character design images has an inverted-U relationship with the expected marketability of merchandised goods.
Hypothesis 3a (H3a): The texture complexity of the character design images has an inverted-U relationship with the consumer preference.
Hypothesis 3b (H3b): The texture complexity of the character design images has an inverted-U relationship with the expected marketability of merchandised goods.
The conceptual framework of this study is presented in Figure 1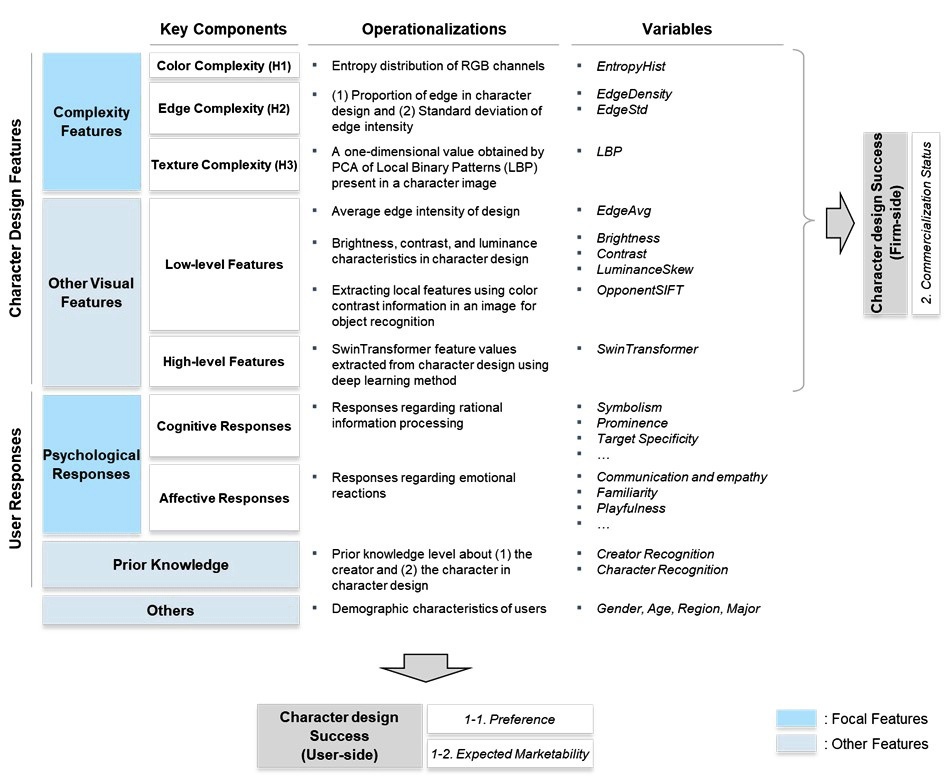
III. Methodology
3.1 Data collection and variables
We collaborated with an online platform company that facilitates transactions between creators and firms of character design in South Korea and administered an online survey from two distinct samples: (1) 100 female respondents in their 20s and 30s, randomly recruited through a well-known domestic market research platform1), and (2) 144 students and graduates from arts-related departments at a major South Korean university (predominantly composed of women). This sampling approach reflects the shifting customer base of the character design market toward millennial and Gen Z women (cf. The study’s potential limitations related to sampling bias and the generalizability of the findings are discussed in Section 5.3).2) Demographic information, including age, gender, and major, was collected from these participants. To assess potential heterogeneity between the two sample groups, we performed t-tests and chi-square analyses. The only statistically significant difference pertained to participants’ art major status, which was accounted for as a control variable in the panel regression model3). For the survey, we selected 150 representative character designs from the Korean market. We adopted a stratified sampling approach to select a total of 150 character designs, divided into three tiers: (1) Tier 1: 50 randomly sampled character designs that are widely recognized by the public and considered to have relatively high commercial value (e.g., Super Mario, Pororo, Sailor Moon); (2) Tier 2: 50 randomly sampled character designs with some degree of public recognition and listed on the marketplace of the online platform company (e.g., Overaction Rabbit, Dora, Nutty); and (3) Tier 3: 50 randomly sampled character designs with minimal recognition and not listed on the marketplace of the online platform company (e.g., Ato, Ogu, Cupid Bear). Public awareness of each character design was operationalized by ranking their Google Trends search volumes in descending order at the time of data collection, after which the 150 characters were reclassified into three distinct awareness tiers. Each participant viewed 30 randomly selected character designs from the pool of 150 items and responded to 19 five-point Likert-scale questions regarding their psychological reactions to the images, focusing on preference and expected marketability (see Appendix A, and Section 5.3 for discussion of the limitation arising from measuring the psychological response variable with a single item). Based on these responses, we constructed 6,530 cross-sectional data points. To ensure consistency, all character images had minimal backgrounds, front-facing views, and no character overlap. They were standardized to 800 × 800 pixels, vertically aligned, and centered with background elements removed. These adjustments preserved original creative intent while maintaining comparability.
As discussed, character designs often serve as key elements in branding. Therefore, in Table 1
Table 1 Psychological Response Variables
| Dimension | Psychological response variables |
|---|---|
| Awareness | Creator recognition, character recognition, familiarity |
| Imagery | Harmony of colors, diversity of images, trendiness, vividness, storytelling, originality, playfulness, symbolism, prominence, target specificity |
| Performance | Usability, sustainability, completeness |
| Feelings | Communication and empathy |
Moreover, we extracted pixel- and object-level variables to characterize the features of the character designs. We focused on three dimensions to measure visual complexity: color, edge, and texture (See Appendix B). Color complexity was represented by color distribution entropy. For edge complexity, we used the standard deviation of edge strength and the proportion of pixels occupied by edges derived from Canny edge detection features. Texture complexity was assessed using the Local Binary Pattern (LBP) method. We reduced the LBP vector to a single dimension, which accounts for over 95% of the variance. Higher LBP values indicate more complex textures. Table 2
Table 2 Character design Images by Levels of Visual Complexity (Illustrative)
| Attributes | High complexity | Low complexity |
|---|---|---|
| Color (Entropy Hist) | ||
| $\text{Entropy Hist} = 14.36$ | $\text{Entropy Hist} = 11.69$ | |
| Edge (EdgeDensity) | ||
| $\text{EdgeDensity} = 0.037$ | $\text{EdgeDensity} = 0.0013$ | |
| Texture (LBP) | ||
| $\text{LBP} = 1.305$ | $\text{LBP} = -0.485$ |
Note: Entropy Hist assesses Euclidean distance in 3D space from color channel entropy. EdgeDensity calculates edge pixel proportion via Canny edge detection. LBP simplifies PCA-reduced vectors from image patterns.
Table 3 Construction of Variables and the Operational Definition
| Variables | Notation | Variable type | Operational definition (measurement) |
|---|---|---|---|
| Dependent Variables | |||
| Preference | $Preference_{ij}$ | Continuous | User preference toward character design images collected through surveys (1–5 points scale) |
| Expected Marketability | $Exp Marketability_{ij}$ | Continuous | User’s expected marketability of character design images collected through surveys (1–5 points scale) |
| Complexity Features | |||
| Entropy Hist | $Entropy Hist_{i}$ | Continuous | Euclidean distance from the origin in a 3D coordinate space composed of the entropy values of each color channel (red, green, blue) extracted from the character design image |
| EdgeDensity | $EdgeDensity_{i}$ | Continuous | The proportion of pixels representing edges in the character design image extracted using Canny edge detection |
| EdgeStd | $EdgeStd_{i}$ | Continuous | Standard deviation (SD) of edge strength in the character design image (i.e., the SD of gradient magnitudes per pixel) extracted using Canny edge detection |
| LBP | $LBP_{i}$ | Continuous | A one-dimensional real-valued feature extracted by applying PCA for dimensionality reduction on a 256-dimensional Local Binary Pattern (LBP) vector extracted from a character design image. |
| Low-level Features | |||
| Edge Avg | $Edge Avg_{i}$ | Continuous | Average edge strength in the character design image (i.e., the mean gradient magnitude per pixel) extracted using Canny edge detection |
| Brightness | $Brightness_{i}$ | Continuous | Average relative luminance value defined by the Web Content Accessibility Guidelines (WCAG) 2.1 (a continuous value ranging from 0 for black to 1 for white) |
| Contrast | $Contrast_{i}$ | Continuous | RMS contrast value calculated from the intensity of valid pixels in the character design image, with alpha values greater than 0 |
| LuminanceSkew | $LuminanceSkew_{i}$ | Continuous | Absolute value of the skewness of the luminance histogram of the character design image |
| High-level Feature | |||
| Swin Transformer | $Swin Transformer_{i}$ | Continuous | A 1024-dimensional image feature vector extracted using Swin Transformer |
| User Responses | |||
| Psycho Vars | $Psycho Vars_{ij}$ | Continuous | Psychological response variables collected from users regarding the character design image via surveys (excluding preference and expected marketability; 1–5 points scale) |
| Prior Knowledge | $Prior Knowledge_{ij}$ | Continuous | Matrix representing the user's prior knowledge level of character design images, collected through a survey (i.e., creator recognition and character recognition; measured on a 1–5 point scale). |
| Demographic Variables | |||
| Gender | $Gender_{i}$ | Discrete | The gender of user i (Reference = Male) |
| Age | $Age_{i}$ | Continuous | The age of user i |
| Region | $Region_{i}$ | Categorical | The residence of user i |
| Major | $Major_{i}$ | Categorical | University major of user i (e.g., Department of Business Administration, Department of Fashion Design, Department of Computer Science) |
| Art Major | $Art Major_{i}$ | Binary | The indicator of whether user i majored or majoring in an arts-related field |
Table 4 Summary of Descriptive Statistics.
| Variable | N | Mean | SD | Min | Max |
|---|---|---|---|---|---|
| Preference | 6,530 | 3.456508 | 1.154622 | 1 | 5 |
| Expected Marketability | 6,530 | 3.576417 | 1.159402 | 1 | 5 |
| EdgeDensity | 6,530 | 0.023301 | 0.013901 | 0.001367 | 0.085055 |
| Edge Avg | 6,530 | 8.455774 | 4.190698 | 0.308984 | 25.60859 |
| EdgeStd | 6,530 | 38.20318 | 13.80328 | 6.036605 | 75.37449 |
| Entropy Hist | 6,530 | 12.36865 | 1.031044 | 11.19274 | 15.16256 |
| LBP | 6,530 | 0.075874 | 0.257302 | -0.48509 | 1.405457 |
| Brightness | 6,530 | 0.7111 | 0.260922 | 0.037958 | 0.9723 |
| Contrast | 6,530 | 0.43087 | 0.131917 | 0.188539 | 0.730256 |
| LuminanceSkew | 6,530 | 2.020022 | 1.340951 | 0.0424996 | 5.871221 |
| Age | 244 | 24.01072 | 4.169212 | 20 | 39 |
| Gender | 244 | 0.796325 | 0.439146 | 0 | 1 |
| Art Major | 244 | 0.512295 | 0.500876 | 0 | 1 |
3.2 Model
To assess the impact of visual complexity on preference and expected marketability of character design images, we used the main independent variables: color, edge, and texture. As indicated in the literature review, we incorporated squared terms for the four complexity variables to account for non-linear relationships. Additionally, we included low-level feature variables—such as brightness, contrast, and exposure (luminance and color distribution)—as covariates. At the object level, we controlled local structure and color relationships using OpponentSIFT, a feature extraction method robust to illumination changes (Van De Sande et al., 2009; see Appendix C). To account for high-level image features, we incorporated the variables extracted through a deep learning-based Swin Transformer model (Liu et al., 2021; Gong et al., 2022; see Appendix D). As discussed, we included the psychological variables measured by the survey. Additionally, we accounted for demographic factors such as age, gender, region, and major. All continuous independent variables were mean-centered prior to analysis to facilitate interpretation and reduce potential multicollinearity, especially when including quadratic terms. Our primary models are expressed in Equations (1) and (2):
where $EdgeDensity_j$ represents the proportion of pixels occupied by edges in character design j, extracted via Canny edge detection; $EdgeStd_j$ denotes the SD of edge strength in character design j; $Entropy Hist_j$ refers to the Shannon entropy of the red, green, and blue intensity values of character design j, represented as a one-dimensional directionless variable; $LBP_j</italic-math>$ captures the texture feature variable derived from the LBP vector, reduced to a single dimension using principal component analysis (PCA); and $LLF_j$ represents the low-level feature vector of character design j, including brightness, exposure, and contrast. $Edge Avg_j$ indicates the average edge strength in character design j, extracted using Canny edge detection; $OpponentSIFT_j$ accounts for color information; and $Swin Transformer_j$ captures local and global high-level feature variables of character design j, derived using a Swin Transformer model. Furthermore, $Psycho Vars_{ij}$ denotes the psychological response variables of user i toward character design j. $Prior Knowledge_{ij}$ represents user i’s prior knowledge of character design j (i.e., creator recognition and character recognition variables). $X_i$ is a matrix representing the demographic characteristics of user i (i.e., a matrix consisting of the vectors $gender_i$, $age_i$, $region_i$ and $major_i$). $\mu_i$ represents a fixed effect for user heterogeneity, while $\pi_j$ represents a fixed effect for character design heterogeneity. Dependent variables include $Preference_{ij}$ (user’s preference for character design j), and $Exp Marketability_{ij}$ represents user i’s expected marketability of character design j. All independent variables involving squared terms were mean-centered to ensure the interpretability of linear coefficients in the quadratic regression models (Aiken et al., 1991).
To further examine the impact of unique characteristics, including visual complexity, influence on the likelihood of actual commercialization, we constructed a logistic regression model at the character design level, as shown in Equation (3).
where $Commercial_j$ represents the actual commercialization status of character design j.4) $\pi_j$ represents a fixed effect for character design heterogeneity. Characters perceived by consumers as having high commercial potential are more likely to be selected for commercialization through corporate market research. Therefore, the mechanism of consumer response to perceived complexity, as discussed above, can similarly apply when the actual commercialization decision is used as the outcome variable.
Ⅳ. Results and discussion
4.1 Results
Table 5 Estimation Results of the Models
| Variables | Dependent Variables: Preference | Dependent Variables: Preference | Dependent Variables: Preference | Dependent Variables: Marketability | Dependent Variables: Marketability | Dependent Variables: Marketability |
|---|---|---|---|---|---|---|
| EdgeDensity | -0.781 (0.724) | 0.744 (0.460) | 0.268 (0.475) | -0.315 (0.354) | -0.109 (0.433) | -0.180 (0.446) |
| $(EdgeDensity)^2$ | -506.7* (192.3) | -491.3*** (181.0) | -322.0* (160.7) | -331.5* (160.1) | ||
| EdgeStd | -0.200 (0.386) | 0.467 (0.736) | -1.257 (0.805) | 0.126 (0.19) | 0.0483 (0.0663) | -0.0505 (0.0407) |
| $(EdgeStd)^2$ | -0.131 (0.079) | -0.544*** (0.176) | -0.00049 (0.000378) | -0.00384* (0.00193) | ||
| Entropy Hist | 10.99*** (3.326) | 2.875** (1.041) | ||||
| $(Entropy Hist)^2$ | -1.183** (0.387) | -0.444** (0.161) | ||||
| LBP | 0.298 (0.274) | 1.939* (0.888) | 5.516*** (2.024) | -0.811 (0.565) | -0.623 (0.903) | -0.455 (1.902) |
| $(LBP)^2$ | -0.138* (0.060) | -0.365*** (0.129) | 0.063 (0.052) | 0.030 (0.121) | ||
| Brightness | -0.603 (2.466) | -0.127 (0.601) | -15.09*** (3.737) | -1.898 (1.453) | -0.354 (0.551) | -6.255 (3.43) |
| Exposure (LuminanceSkew) | 1.782 (1.644) | 0.685 (0.357) | -1.59 (0.957) | 2.968* (1.509) | 1.135*** (0.327) | -0.596 (0.878) |
| Edge Avg | 1.026 (0.727) | -0.197 (0.194) | 2.594*** (0.699) | -0.417 (0.667) | 0.042 (0.178) | 1.252 (0.641) |
| Psychological Response Variables | ||||||
| Symbolism | -0.00634 (0.0119) | -0.00634 (0.0119) | -0.00634 (0.0119) | 0.0530*** (0.0109) | 0.0530*** (0.0109) | 0.0530*** (0.0109) |
| Prominence | 0.00589 (0.0122) | 0.00589 (0.0122) | 0.00589 (0.0122) | 0.0523*** (0.0112) | 0.0523*** (0.0112) | 0.0523*** (0.0112) |
| Target specificity | 0.0201 (0.0109) | 0.0201 (0.0109) | 0.0201 (0.0109) | 0.0555*** (0.01) | 0.0555*** (0.01) | 0.0555*** (0.01) |
| Prior knowledge variables | ||||||
| Creator recognition | 0.0133 (0.00805) | 0.0133 (0.00805) | 0.0133 (0.00805) | -0.0125 (0.00739) | -0.0125 (0.00739) | -0.0125 (0.00739) |
| Character recognition | 0.00421 (0.00793) | 0.00421 (0.00793) | 0.00421 (0.00793) | 0.00446 (0.00728) | 0.00446 (0.00728) | 0.00446 (0.00728) |
| Age | -0.00624 (0.148) | 0.185 (0.103) | 0.00628 (0.148) | 0.0888 (0.140) | 0.207* (0.0978) | 0.183 (0.141) |
| Const | -15.401 (6.595) | -6.170 (5.082) | -2.261 (2.513) | -2.064 (6.198) | -3.677 (4.776) | -2.064 (6.198) |
| OpponentSIFT | Yes | Yes | Yes | Yes | Yes | Yes |
| Swin transformer | Yes | Yes | Yes | Yes | Yes | Yes |
| User-fixed effects | Yes | Yes | Yes | Yes | Yes | Yes |
| Character-fixed effects | Yes | Yes | Yes | Yes | Yes | Yes |
| Observations | 6,530 | 6,530 | 6,530 | 6,530 | 6,530 | 6,530 |
| Number of images | 150 | 150 | 150 | 150 | 150 | 150 |
| $R^2$ | 0.6253 | 0.5699 | 0.4366 | 0.7053 | 0.716 | 0.614 |
| F-value | 4.41*** | 4.44*** | 4.42*** | 5.04*** | 5.05*** | 5.05*** |
Notes: Standard errors are in parentheses. p < 0.05, p < 0.01, p < 0.001.
4 The commercialization status of the character designs was determined through keyword search results on major Korean e-commerce platforms. These include Coupang, Naver Shopping, G-market, Auction, and 11st. This information was validated further using commercialization history data from the character design trading platform. We were able to identify a total of 52 commercialized characters.
Additionally, the negative regression coefficient of $(LBP)^2$ In the preference model, it indicates that the texture complexity of a character design image, represented by LBP, also exhibits an inverted-U relationship with consumer preference (i.e., H3a is supported). This implies that consumer preference peaks at an optimal level of texture complexity. However, no consistent results were observed regarding the relationship between texture complexity and expected marketability.
Regarding psychological responses, attributes related to symbolism, prominence, and target specificity did not significantly affect preference but positively and significantly impacted expected marketability. This indicates that consumers perceive character design images with a clear target audience, high memorability, distinct visuals, and symbolic attributes as having higher expected marketability. Additionally, prior knowledge of character design, including character or creator recognition, did not significantly influence preference or expected marketability.
Table 6 Estimation Result of the Logistic Regression Model.
| Variables | Logistic Regression (DV: Commercialization) | |
|---|---|---|
| Coefficient | Standard Error | |
| EdgeDensity | 0.7655 | 0.677 |
| $(EdgeDensity)^2$ | -0.2472 | 0.168 |
| EdgeStd | -0.1985 | 0.717 |
| $(EdgeStd)^2$ | 0.3312 | 0.210 |
| Entropy Hist | 3.2032 | 2.678 |
| $(Entropy Hist)^2$ | -0.0566 | 0.519 |
| LBP | 1.9380 | 1.787 |
| $(LBP)^2$ | -7.6267* | 3.107 |
| Brightness | -0.5236 | 0.805 |
| Contrast | 0.5472* | 0.245 |
| Exposure | ||
| LuminanceSkew | 10.5799 | 5.343 |
| Edge Avg | -0.1417 | 0.1806 |
| Edge Max | 0.9250* | 0.405 |
| Character-fixed effects | Yes | |
| Observations | 150 | |
| $Pseudo\ R^2$ | 0.4058 | |
Notes: Standard errors are in parentheses. p < 0.05, p < 0.01, p < 0.001.
Table 7 Summary of Determinants of Character Design’s Marketability
| Category | Determinants | Summary |
|---|---|---|
| Color complexity | Entropy Hist | Preference, Expected marketability (Inverted-U) |
| Edge complexity | EdgeDensity EdgeStd | Preference, Expected marketability (Inverted-U) Preference, Expected marketability (Inverted-U), Commercialization |
| Texture complexity | LBP | Preference, Commercialization (Inverted-U) |
| Psychological response | Symbolism | Expected Marketability |
| Prominence | Expected Marketability | |
| Target specificity | Expected Marketability | |
| Other features | Contrast | Commercialization |
| Edge Max | Commercialization |
4.2 Supplementary analysis
We applied K-means clustering to assess the relationship between visual features, psychological response variables, and commercialization outcomes. Clustering variables included color, edge, texture complexity measures from the main analysis, edge intensity-related variables, contrast, brightness, and exposure (i.e., “LuminanceSkew”), along with other low-level features and psychological response variables. Based on the elbow method, the optimal number of clusters was determined to be three. The relationship between these factors and the binary commercialization outcome $(Commercial_j)$ was examined.
Table 8 K-Means Clustering Result of Character Designs.
| Cluster | Contrast | Brightness | Luminance Skew | Edge Avg | Edge Std | Edge Density | Edge Max | Entropy Hist | LBP | Commer-cial |
|---|---|---|---|---|---|---|---|---|---|---|
| 0 | 0.367 | 0.873 | 2.546 | 8.188 | 38.235 | 0.018 | 376.452 | 11.759 | -0.04826 | 0.083 |
| 1 | 0.454 | 0.744 | 1.373 | 5.720 | 25.909 | 0.026 | 383.805 | 12.435 | 0.29610 | 0.431 |
| 2 | 0.542 | 0.357 | 1.272 | 11.145 | 47.790 | 0.032 | 486.496 | 13.548 | -0.13493 | 0.898 |
| Average | 0.431 | 0.711 | 2.041 | 8.456 | 38.203 | 0.023 | 406.887 | 12.369 | 5910.731 | 0.369 |
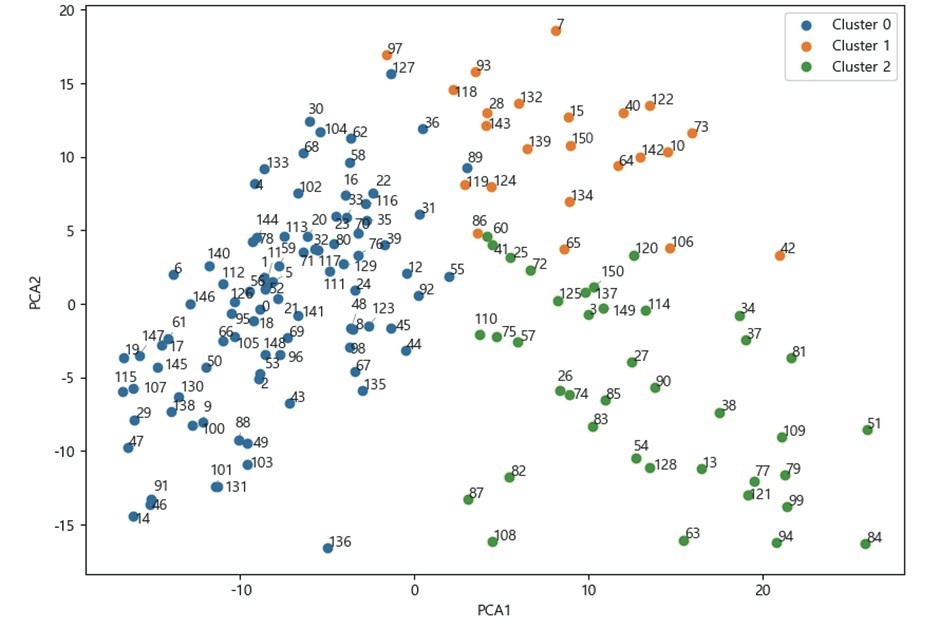
Table 9 PCA Factor Loadings For Principal Component Axes (Top 10)
| Rank | Axis 1 (PCA 1) Variable | Axis 1 (PCA 1) Weight | Axis 2 (PCA 2) Variable | Axis 2 (PCA 2) Weight |
|---|---|---|---|---|
| 1 | Usability | 0.232481 | EdgeStd | 0.420938 |
| 2 | Sustainability | 0.232257 | Edge Avg | 0.420938 |
| 3 | Prominence | 0.230796 | EdgeDensity | 0.413202 |
| 4 | Symbolism | 0.230527 | Contrast | 0.405363 |
| 5 | Diversity of images | 0.227907 | Entropy Hist | 0.247000 |
| 6 | Character recognition | 0.227555 | Originality | 0.202022 |
| 7 | Originality | 0.227242 | Creator recognition | 0.198175 |
| 8 | Familiarity | 0.225890 | Character recognition | 0.125238 |
| 9 | Storytelling | 0.223263 | Storytelling | 0.017035 |
| 10 | Completeness | 0.222759 | Completeness | 0.004781 |
Ⅴ. Conclusion
5.1 Theoretical implications
This study is among the first to examine the impact of character design image complexity on marketability. We identified distinct effects by categorizing visual complexity into color, edge, and texture dimensions. Additionally, we highlighted differences in perceived commercialization factors between individual consumers and corporate users. The results suggest that visual complexity is a critical consideration at the corporate (e.g., licensees) level, and factors such as contrast and maximum edge strength, which indicate clear object representation, directly influence their commercialization decisions.
In marketing, prior research on visual complexity and consumer responses has primarily focused on advertising and product packaging. This study expands the scope by applying these concepts to character designs as commercialized products. By integrating machine learning-based image analysis and low-level feature extraction, we control for intrinsic image characteristics while accounting for individual cognitive heterogeneity. These methodological advancements contribute to the growing literature on visual complexity, consumer perception, and character design marketability.
5.2 Managerial implications
This study underscores the importance of visual elements in corporate decision-making. As character designs are developed primarily for commercialization—in-house or through licensing—understanding their influence on consumer preference and marketability is essential for revenue generation. Although companies invest substantial resources in enhancing character design designs, excessive complexity may lead to adverse consumer reactions. This study highlights the need for a data-driven, market-aware approach to character design and licensing strategies.
These findings suggest that design teams should adopt a balanced approach to visual complexity, leveraging consumer insights early in the design process to avoid over- or under-designed characters. Marketing and product managers can benefit from using quantifiable visual indicators, such as edge intensity (e.g., Edge Avg), color variation (e.g., Entropy Hist), and texture clarity (e.g., LBP), to evaluate and refine character designs before market launch. Furthermore, firms utilizing generative AI or design automation tools should integrate complexity thresholds into their algorithms to align visual output with consumer preferences. In the context of licensing, companies can enhance pricing strategies by assessing how design features influence perceived value. Overall, a systematic understanding of visual complexity enables companies to better manage design portfolios, reduce market risk, and improve the effectiveness of character-based branding and merchandising efforts.
Moreover, the cluster analysis leveraging character complexity features extracted via machine learning offers concise, practice-oriented insights for firms and practitioners pursuing character commercialization, specifically, which market segments to target and how to target them. For example, when organizations develop characters to meet immediate the companies' marketing needs, customers' psychological responses are often insufficiently considered; this gap can be remedied by explicitly incorporating such considerations into character design. Likewise, when creators or firms design characters independently, a strategy of conducting market research to identify features likely to elicit favorable psychological responses, and integrating those features into the design process, may be warranted.
5.3 Limitations and future research
This study has several limitations that call for additional research. First, the character design samples were limited to the South Korean market. As cultural factors influence character design evaluations, future research should explore global character designs to improve generalizability.
Second, the participant sample consisted mainly of South Korean women in their 20s and 30s, including a large proportion of art students and graduates. While this reflects the growing influence of younger female consumers in character-driven markets, the findings may not generalize to other demographics such as men, older consumers, or those from different cultural backgrounds. In addition, unmeasured factors, such as aesthetic sensitivity or design-related motivation, may have influenced responses. Broader and more diverse samples are needed in future research to improve external validity.
Third, the study included character designs that had already been commercialized and available on the market as part of the survey. This may have led to overestimating expected marketability among survey participants, which introduced bias into the estimation results. Although we controlled for prior knowledge of the character design or its creator in our model, this approach may not entirely eliminate potential biases. To mitigate such issues, it is necessary to adopt a blind test design focusing on non-commercialized characters or to refine the level of control over recognition-based variables. Additionally, we measured the psychological variable using a single item, constituting a potential threat to measurement validity. Future research could more robustly address potential reliability and validity concerns by employing multi-item measures (e.g., Cronbach’s alpha test).
Fourth, the regression models identified several statistically significant predictors of character preference and perceived marketability. Although some coefficients, particularly for psychological reaction variables, were modest in size (e.g., 0.01 to 0.05), they nonetheless point to consistent patterns worth noting. These findings highlight the importance of considering both statistical significance and effect size when interpreting results, and future research could further examine how these dimensions interact in shaping consumer responses.
Finally, the study did not account for additional commercialization factors, such as character design popularity in mass media and word-of-mouth effects on social media. Given the unpredictable nature of entertainment product success, a more systematic examination of external market dynamics would strengthen the findings. Future research should analyze these factors to offer a more comprehensive framework for character design commercialization.
Appendix A. Survey Questionnaire Design
Appendix B. Visual Complexity Measures of Character Design
Appendix B. Visual Complexity Measures of Character Design
B1. Color complexity: Color distribution entropy
Entropy, as introduced by Tsai et al. (2008), quantifies an image’s information content and visual complexity based on pixel intensity distribution. Traditionally, entropy is computed using Shannon entropy from an intensity histogram, where higher entropy signifies greater complexity and lower entropy indicates uniformity. However, in images where individual color channels (red, green, and blue) contain significant visual information, preserving color-specific features is essential (Sun et al., 2006). By calculating Shannon entropy for each channel separately, a more precise assessment of visual complexity can be achieved, making this approach particularly relevant for character design analysis.
B2. Edge complexity: Canny edge density and SD of Canny edge strength
The Canny edge detection algorithm is widely used owing to its optimal performance in signal-to-noise ratio, localization precision, and single edge response (Canny, 1986). The method involves Gaussian filtering, gradient computation, non-maximum suppression, and double thresholding to effectively identify edges in an image. By effectively reducing noise and preserving edge details, this well-established approach is robust across a wide range of scenarios.
Despite its advantages, traditional Canny edge detection has limitations in handling noise and weak edge preservation. To address these issues, Rong et al. (2014) proposed gravitational field intensity as an alternative to conventional gradient calculation, enhancing edge detection robustness. This approach effectively captures edge features by replacing gradients with gravitational field intensity. This enables it to become particularly effective in noisy environments and for detecting weak edges. Using Canny edge detection, two key metrics can be derived: the SD of edge intensities and edge density (Canny, 1986). The SD of magnitude measures variations in gradient values, capturing the fluctuations in edge strength. A larger SD suggests significant differences in edge intensities across the image. Finally, edge density is defined as the ratio of pixels identified as edges to the total number of pixels, with values ranging between 0 and 1. Higher values suggest a greater concentration of edge information, signifying higher image complexity. These two indicators serve as proxies for assessing edge-based complexity in character IP images.
B3. Texture complexity: Local Binary Pattern
LBP is a widely used texture analysis technique that encodes the intensity relationships between a central pixel and its surrounding pixels into binary patterns (Ojala et al., 2002; Heikkilä et al., 2009). These binary patterns are converted into decimal values to generate an LBP map, from which a histogram represents the local texture distribution. Greater variation in LBP values indicates higher texture complexity, while fewer unique patterns suggest uniform textures. LBP is advantageous because of its robustness against illumination changes, computational efficiency, and ability to capture fine-grained local structures. Additionally, dimensionality reduction techniques such as PCA can be applied to LBP histograms, preserving texture variability while improving efficiency. These properties make LBP a reliable indicator of texture complexity across diverse image analysis applications (Liu et al., 2016).
Appendix C. OpponentSIFT
OpponentSIFT extends the Scale-Invariant Feature Transform (SIFT) technique into the opponent color space, enabling independent processing of luminance and chromatic variations. This method enhances robustness to lighting changes, making it effective for object and scene recognition. The opponent color space consists of three channels: $Q_1, Q_2, Q_3$, where $Q_3$ represents luminance information, and $Q_1$ and $Q_2$ encapsulate chromatic information. OpponentSIFT applies SIFT separately to each channel to extract distinctive features, improving resilience against illumination shifts. This technique is particularly beneficial in video-based applications, where lighting conditions fluctuate frequently. Experimental evaluations on the Mediamill Challenge and PASCAL VOC datasets demonstrate that OpponentSIFT outperforms single-channel SIFT methods and achieves optimal results when combined with other color descriptors (van De Sande et al., 2009).
In this study, SIFT features were extracted from each opponent channel and reduced to 75 dimensions using PCA. This dimensionality reduction preserved over 95% of total variance while significantly enhancing computational efficiency. The final feature vectors effectively encapsulate local image structure (gradient-based), color relationships (opponent color space), and scale invariance (inherent to SIFT). This approach not only retains over 95% of the total variance but also significantly enhances the computational efficiency.
Appendix D. Swin Transformer
The Swin Transformer introduces a hierarchical vision transformer architecture optimized for computational efficiency and accuracy in computer vision tasks. Unlike conventional transformers, which apply global self-attention, the Swin Transformer employs a shifted window approach, restricting self-attention to nonoverlapping windows. This design reduces computational complexity to linear scalability relative to image size while preserving cross-window connections by shifting window partitions between layers. As a result, the Swin Transformer enhances efficiency and is particularly effective for dense prediction tasks, including semantic segmentation and object detection.
This architecture constructs hierarchical feature maps by progressively merging image patches in deeper layers, enabling multiscale representations. Its hierarchical design allows adaptability across various vision tasks, from image classification to dense prediction. The Swin Transformer outperforms state-of-the-art models such as ViT and Res Net, achieving 87.3% top-1 accuracy on Image Net-1K, 58.7 box AP on COCO object detection, and 53.5 mIoU on ADE20K semantic segmentation (Liu et al., 2021). These results underscore its potential as a general-purpose vision backbone, bridging the gap between traditional CNN-based models and modern transformer architectures.
Table 1 Survey Questionnaire Design
| Dimension | Psychological response variable | Questionnaire |
|---|---|---|
| Marketability | Preference Expected Marketability | “To what extent do you prefer this character design?” “To what extent do you think this character design is marketable?” |
| Awareness | Creator recognition | “To what extent are you aware of the creator of this character design?” |
| Character recognition | “To what extent do you recognize the character depicted in this design?” | |
| Imagery | Harmony of colors | “The colors in the character design appear harmonious.” |
| Diversity of images | “The character design conveys a sense of visual diversity.” | |
| Trendiness | “The character design feels suitable for the current era.” | |
| Vividness | “The character design appears vivid and lively.” | |
| Storytelling | “The image suggests a background story for the character.” | |
| Originality | “The character design appears original and distinctive.” | |
| Playfulness | “The character design seems playful.” | |
| Symbolism | “The character design conveys symbolic meaning.” | |
| Prominence | “The character design is attention-grabbing.” | |
| Target specificity | “The target audience for this character is clearly defined.” | |
| Performance | Usability | “The character seems versatile and broadly applicable.” |
| Sustainability | “The character appears to have sustainability.” | |
| Completeness | “The character design appears complete and well-developed.” | |
| Feelings | Communication & empathy | “The character evokes a sense of communication and empathy.” |
| Familiarity | “The character design conveys familiarity and emotional closeness.” |