
.jpeg)
Speaker-Independent Recognition of Negative Nonverbal Behaviors for AI-Based Oral Presentation Assessment
1 경북대학교 경영학부 석박사통합과정 Kyungpook National University(ufo1112@naver.com)
2 경북대학교 경영학부 석사과정 Kyungpook National University(yyhoon06@gmail.com)
3 경북대학교 경영학부/문화산업연구소 부교수 Kyungpook National University(saeromlee@knu.ac.kr)
DOI: https://doi.org/10.17287/kmr.2026.55.5.1901
Abstract
Presentation is a core competency required in organizational reporting, proposals, and interviews, yet presenters find it difficult to recognize their own nonverbal behavior and to receive consistent feedback. This study develops and evaluates a model that recognizes negative nonverbal behaviors during presentations and classifies them into twelve categories, to support AI-based oral presentation feedback. Unlike existing systems that remain at holistic scores or the detection of a few behaviors, the model classifies a presenter's skeletal motion into individual behavioral units, providing a basis for specific feedback. The analysis uses nonverbal keypoint data from 800 presenters in AI-Hub's Public Speaking Practice and Evaluation Data and applies a speaker-independent evaluation in which no presenter's data appear in both training and evaluation. Deep-learning models achieved stable performance of around 90% macro-F1 on presenters unseen during training, and in this task the composition of the evaluation split affected the reported performance more than the choice of model did. A lightweight model remained within one percentage point of the best-performing model in accuracy, with classification latency low enough that this stage would not be the bottleneck for real-time feedback. These results provide a technical foundation for AI-based oral presentation feedback to serve as a fine-grained behavioral feedback tool in management education and organizational communication competency development.
This research, undertaken at Kyungpook National University, was supported by the ANCHOR program through the Daegu ANCHOR Center, funded by the Ministry of Education (MOE) and the Daegu Metropolitan City, Republic of Korea.(2026-ANCHOR-03-001)
I. Introduction
Presentation is a core competency required repeatedly in organizational activities and individual careers, from corporate reporting and proposals to investment fundraising and hiring interviews (Maes et al., 1997; Robles, 2012). For organizations, the managerial issue is not only how to assess such performance but also how to provide specific and consistent opportunities for repeated skill development at scale. Prior interview research shows that applicants' nonverbal cues and self-presentation behaviors can influence interviewers' judgments (Barrick et al., 2009; DeGroot and Motowidlo, 1999), underscoring the managerial relevance of nonverbal behavior. The present study does not treat the 12 behaviors as selection criteria, however. Instead, it focuses on the design and evaluation of a recognition component that can support behavior-level feedback in communication training. Because this ability tends to improve through repeated practice and feedback (Hattie and Timperley, 2007), evaluating whether an AI-based training component provides specific outputs, generalizes to new members, and can be deployed efficiently constitutes a problem of human-resource development and organizational AI adoption as well as a technical modeling problem.
Along with the digital transformation of education, Korea's e-learning market grew to about KRW 5.6 trillion in revenue as of 2023 (Ministry of Trade, Industry and Energy et al., 2024). At the same time, the spread of artificial intelligence is prompting a redesign of human resource management as a whole, including recruitment, education and training, and evaluation (Park and Yang, 2020; Lee et al., 2025). This shift has, in turn, led to discussions of competency-development tools such as large language model-based AI mentoring (Lee, 2024). This study defines the presentation performance that is the object of such training and feedback as public speaking―that is, the performance act in which a presenter conveys information or an argument to an audience and forms the audience's understanding and trust (Lucas, 2020). The effectiveness of public speaking is determined not only by the content of the speech but also by nonverbal behaviors such as voice, posture, gaze, and hand movements. Thus, nonverbal cues act directly on the audience's perception of the presenter's competence and trustworthiness (Burgoon et al., 1990).
However, feedback on presentation performance has largely relied on the observation of human experts such as instructors, evaluators, interviewers, and supervisors (Chen et al., 2016). Such reliance allows evaluators to consider contextual factors in detail. In settings where individuals engage in repeated practice, however, it also creates challenges: substantial time and labor requirements, variability across evaluators, and inconsistency in feedback (Ochoa et al., 2018). From an organizational standpoint, the issue is therefore not only whether presentation performance can be scored, but whether feedback can be delivered consistently and at a level that members can act on. Feedback research distinguishes task-focused information from self-focused judgments and emphasizes the value of information that helps learners identify what needs to be improved (Hattie and Timperley, 2007; Kluger and DeNisi, 1996). The behavior-level recognition examined in this study can serve as a technical component for such specific feedback by identifying concrete movement categories rather than producing only a holistic score. This study, however, does not test whether behavior-level feedback itself improves learning or transfer to workplace performance. To address the limitations of expert-dependent feedback, prior research has proposed oral presentation automated feedback systems (OPAFs) that analyze presentation performance using multimodal data such as audio, video, and speech transcript data (Chen et al., 2014, 2016; Chollet et al., 2016; Ochoa et al., 2018; Tanveer et al., 2015).
Yet existing public speaking datasets are generally small and limited in scale (Chen et al., 2014, 2016; Wörtwein et al., 2015), or often use nonverbal behavior only as auxiliary features for score prediction (Sümer et al., 2021). As a result, existing OPAFs can only provide an overall performance score, offering limited guidance on which specific nonverbal behaviors a user should correct. A further problem concerns how these datasets are split for evaluation. Many public datasets contain multiple clips derived from the same presentation in both the training and validation sets, so reported performance may overestimate a model's ability to generalize to new presenters―even though performing well on presenters not seen during training is exactly what a practical OPAF requires. Participant- and speaker-independent validation has become the standard in human activity recognition, in medical repeated-measures research, and in skeleton-based action recognition (Dehghani et al., 2019; Karbalaie et al., 2026; Liu, Shahroudy, et al., 2020; Shahroudy et al., 2016). Even so, performance is sometimes reported using a released split as is, without checking for such overlap. This study aims to provide a basis for finer-grained OPAFs by identifying these nonverbal behaviors at the individual level. From this perspective, this study develops an AI model that classifies negative nonverbal behaviors during a presentation into individual behavioral units that a user can identify, correct, and validates it from the perspective of generalization to new presenters. Throughout this paper, speaker-independent evaluation denotes an evaluation design in which no presenter's data appear in both the training and evaluation sets, so that performance is measured on presenters not seen during training. In other words, speaker-independent refers to how the data are split for evaluation rather than to a separate model architecture, and it is unrelated to speaker diarization in audio processing. Specifically, we examine (1) whether negative nonverbal behaviors can be classified into 12 categories from skeleton data, (2) how performance under the speaker-independent condition differs from that of the official split, and (3) which model is suitable for an actual service from the perspective of the accuracy–latency trade-off.
Using AI-Hub's Public Speaking Practice and Evaluation Data (National Information Society Agency, 2024), which encodes the negative nonverbal behaviors of 800 presenters into 12 categories (B01-B12), we formulate a 12-class negative-gesture classification task specialized for Korean presentations. We compare performance under the speaker-independent split with performance under the official split.
The contributions of this study are as follows. First, we construct a speaker-independent split and quantify the performance difference from the official split, confirming a generalization performance of about 90% macro-F1 even for presenters not included in training, and distinguishing this from performance due to data composition. Second, we formulate the AI-Hub skeleton data as a 12-class negative-gesture classification task and present it as a data basis for individual behavioral feedback. Third, by comparing classical machine learning and deep-learning models under a common data-split and evaluation framework, we show that the evaluation design has a greater effect on performance than the choice of model. Fourth, by analyzing inference latency together with accuracy, we examine the deployment feasibility of a lightweight model whose classification stage runs on a general-purpose CPU alone. These results have theoretical and practical implications in that they provide a technical foundation for OPAFs to serve as a fine-grained formative feedback tool in organizational communication competency development.
Ⅱ. Related Work
2.1 Prior Research on OPAFs
Research on OPAFs (Hummel et al., 2025; Ochoa and Zhao, 2024) has analyzed presenter performance across multiple modalities, such as audio, video, and speech transcripts, to predict human ratings or to point out areas for improvement. Prior studies designed scoring models that quantify the multimodal cues arising in presentation performance. Chen et al. (2016) built an automated scoring model that predicts presentation scores from features extracted from speech content, delivery, and hand and head movements. Chollet et al. (2016) constructed a multimodal corpus that includes audio, video, behavior annotations, and measures of public speaking anxiety. These systems, however, output holistic scores or scale ratings for the presentation as a whole. From the user's perspective, item-level information is more useful for improving presentation skills than a holistic score (Oh, 2015; Hattie and Timperley, 2007), which has prompted calls to improve on such systems.
More recent systems provide feedback during practice, in or near real time. Tanveer et al. (2015) analyzed volume and speaking rate in real time and relayed them to the presenter during the talk. Schneider et al. (2015) monitored six aspects of delivery, including posture, gestures, volume, and pauses, and immediately alerted the presenter when a behavior violated predefined rules. RAP system suggested by Ochoa et al. (2018) used low-cost sensors to produce reports on posture, gaze, volume, filler words, and the quality of presentation materials. Ochoa and Domínguez (2020) evaluated a RAP-based multimodal feedback system in a real learning setting. Automated feedback affected presentation dimensions unevenly, though expert-rated follow-up presentations showed a small but statistically significant improvement. Sichterman et al. (2026) reported that in an immersive virtual reality (IVR) practice environment, AI-only feedback can produce results comparable to teacher-supported AI feedback in presentation performance, reduction of presentation anxiety, and perceived usefulness of the feedback. Sichterman et al. (2026) suggest that OPAFs can complement instructor feedback as a formative assessment tool for specific performance elements such as nonverbal behavior. An adjacent line of research has used virtual humans for interview and social-skills training. MACH provides a virtual-agent-based environment for practicing social interaction and receiving automated feedback on verbal and nonverbal behavior (Hoque et al., 2013), while the TARDIS framework uses intelligent virtual agents for social coaching in job interviews (Anderson et al., 2013). These studies demonstrate that automated or virtual-agent coaching has been applied in interview-training contexts; they do not, however, establish that the 12 presentation-behavior categories used in the present study transfer directly to interviews. Across the OPAF systems reviewed above, feature extraction is automated, but the judgment stage still relies on human-defined rules and thresholds or on judgment models built from expert advice. Moreover, the behaviors actually detected are limited to a small set of movements, such as crossed arms (Schneider et al., 2015) or hands in pockets (Ochoa et al., 2018). Feedback is also delivered as numbers, such as the proportion of time spent in poor posture or the frequency of pauses, so tracing those numbers back to one's own specific movements is left to the user.
In response to these limits, later systems have addressed nonverbal behavior and presentation cues more directly. Wörtwein et al. (2015) automatically extracted nonverbal cues such as gaze, facial expression, gestures, and voice quality in a virtual-audience training environment and showed that these cues can approximate expert ratings of presentation performance. Fung et al. (2015) suggested ROC Speak which computes indicators such as smile intensity, body movement, and volume modulation from webcam-recorded videos. ROC Speak combined these indicators with time-stamped comments from Mechanical Turk raters so that users could explore their own nonverbal behavior. Tanveer et al. (2016) extracted repetitive body-movement patterns from Microsoft Kinect skeleton data and, through their system AutoManner, presented them as timelines and skeleton animations so that presenters could notice habitual movements (mannerisms) they had not been aware of. SpeechMirror (Huang et al., 2024) took a broader approach, visualizing facial expressions, gaze, stage use, body gestures, voice, speaking rate, and the script in online talks. This let users reflect on their body language within the original video context and explore room for improvement. These studies considered the granularity of movement and the generalization problem to varying degrees, but their aims and output units differ. None of them directly addressed the task of classifying predefined, fine-grained skeletal behavior categories under speaker-independent conditions (Fung et al., 2015; Huang et al., 2024; Tanveer et al., 2016; Wörtwein et al., 2015).
This study therefore takes up that task for Korean presentation data, classifying individual nonverbal movements during a presentation into 12 categories spanning the hands, head, arms, and posture. It further examines, through speaker-independent evaluation, whether these behavior categories apply reliably to presenters not included in training.
2.2 Skeleton-Based Recognition of Nonverbal Behaviors
Automatically recognizing nonverbal behavior first requires deciding what information from the video will serve as the unit of analysis. The skeleton-based representation adopted in this study arranges the coordinates of body joints, extracted frame by frame, in temporal order, capturing both the spatial relations among body parts and their movement over time. Joint trajectories are relatively less affected by recording-environment factors such as illumination changes and background (Song et al., 2020; Yan et al., 2018), and the data are more compact than raw RGB video, making them easier to process under limited computing resources (Xin et al., 2023). The representation also offers explainability, as recognition results can be interpreted at the level of the movements of specific joints or body parts (Song et al., 2020), and feedback based on body movement, such as posture and gestures, has already been used in automated feedback services that support repeated presentation practice (Schneider et al., 2015).
Research on recognizing actions from skeleton coordinates has developed around graph convolutional networks (GCNs) since the spatial–temporal graph convolutional network (ST-GCN; Yan et al., 2018). This approach treats the skeleton as a graph of interconnected joints and jointly learns the connections among joints and their changes over time. The original ST-GCN kept this graph structure fixed; as it became clear that a fixed structure is not optimal for every action, later models were refined so that the connections among joints adjust flexibly to each action, with corresponding gains in recognition accuracy (Chen et al., 2021; Liu, Zhang, et al., 2020; Shi et al., 2019). In particular, Duan et al. (2022) presented ST-GCN++ as a baseline model that achieves high performance without relying on complex techniques.
Efforts to make these models lighter have continued in parallel. Lightweight models that reduce computation and the number of parameters while minimizing accuracy loss have been proposed (Cheng, Zhang, Cao, et al., 2020; Cheng, Zhang, He, et al., 2020; Song et al., 2020; Zhang et al., 2020), and trends in transformer-based approaches have recently been reviewed (Xin et al., 2023). In this way, the field of skeleton-based action recognition has accumulated a range of options that trade off recognition accuracy against computational efficiency.
These models have mostly been developed and validated on the public dataset NTU RGB+D. NTU RGB+D is a large-scale collection of diverse everyday actions performed by many participants, recorded as RGB video, depth information, and three-dimensional skeleton sequences (Shahroudy et al., 2016); it is large in scale and is provided with an official split that separates training and evaluation data. This allows different models to be evaluated on the same data and the same split so that their performance can be compared directly, and for this reason it has been widely used as a standard reference, that is, a benchmark, for gauging performance in skeleton-based action recognition research (Chen et al., 2021; Duan et al., 2022; Liu, Zhang, et al., 2020; Shi et al., 2019; Yan et al., 2018). The performance differences reported on such a benchmark, however, are difficult to interpret directly as evidence that one model architecture is superior. Duan et al. (2022) re-evaluated several models under identical preprocessing, augmentation, and training settings and found that the maximum deviation in top-1 accuracy across models (the proportion of instances in which a model's highest-probability prediction matches the correct label) was less than 2 percentage points; they reported that experimental practices such as preprocessing and training configuration contributed substantially to the performance comparison. This suggests that judging the relative merits of model architectures requires consistent control of the input data, the evaluation split, and the training conditions.
The action categories in NTU RGB+D, moreover, differ in character from those in a presentation setting. This dataset consists largely of everyday actions with relatively clear-cut movement forms, such as drinking water, picking up an object, throwing, sitting down, and standing up, or of interactions between people. Negative nonverbal behaviors during presentations, by contrast, include kinematically similar categories, such as tossing the head back to flick away hair versus shaking the head from side to side, and thus demand finer distinctions; they also differ from the actions in general-purpose datasets in that they occur only within the limited context of a presentation. Because the meaning of a nonverbal behavior can vary with the context in which it appears (Tanveer et al., 2016), the action categories of a general-purpose benchmark alone are insufficient to represent negative nonverbal behaviors during presentations. Such behaviors therefore need to be addressed separately, using data specific to the presentation setting. Accordingly, drawing on presentation-specific data, this study compares classical machine learning models based on hand-crafted features, GCN-family models, and temporal convolutional network (TCN)-family models that learn patterns along the temporal order, under a common data-split and evaluation framework. The focus of the analysis is not on claiming the absolute superiority of any particular model architecture, but on characterizing the trade-off between classification accuracy and deployment efficiency that each model exhibits in the domain of presentation behavior recognition.
2.3 Evaluation Protocols and Generalization
To examine generalization in skeleton-based action recognition, the data are split so that different people appear in training and in evaluation. The cross-subject protocol introduced with the NTU RGB+D benchmarks is the standard example; it measures performance on the actions of people not seen during training (Liu, Shahroudy, et al., 2020; Shahroudy et al., 2016). The purpose is to avoid the overestimation that occurs when data from the same person appear in both training and evaluation.
The same problem has been noted in other fields. In human activity recognition, adjacent segments of a partitioned time series resemble one another, so cross-validation with random splits overestimates user-independent performance (Hammerla and Plötz, 2015). In studies using repeated-measures medical data, estimates of predictive performance can likewise be optimistic when data from the same participant appear in both training and evaluation, and participant-level separation has been recommended (Dehghani et al., 2019; Karbalaie et al., 2026).
The issue becomes especially clear when performance is reported on open datasets. If similar clips derived from the same presentation or the same presenter enter both the training and validation data, the reported figures can overestimate generalization to new presenters (Dehghani et al., 2019; Hammerla and Plötz, 2015). Even when a released split is used as is, whether data from the same presenter or participant are duplicated across training and evaluation needs to be checked separately (Dehghani et al., 2019; Karbalaie et al., 2026). With this in mind, this study constructs a split in which no presenter's clips are divided between training and validation and analyzes the performance difference from the official split.
From the standpoint of management education and organizational training, this aspect of evaluation design goes beyond technical convention: it bears on the validity of the performance evidence used in adoption decisions. If performance inflated by presenter overlap is read as performance on new members, expectations of how the system will perform in actual use become too optimistic. Generalization across people is, however, only one dimension of generalization: robustness to new recording environments, presentation tasks, and naturally occurring behaviors is a separate matter that calls for validation on external data.
2.4 Limitations of Prior Research and Requirements
The studies above indicate that designing an OPAF is not only a matter of securing high predictive performance; the output unit and the evaluation criteria must fit the purpose the system serves. Choi et al. (2024) identified the design elements of an automated scoring model for Korean speaking: the purpose and type of assessment, the constructs and scoring features to be measured, the score scale, the scope of automation, the task type, and the system type. They argued that these elements should be decided jointly, in light of the assessment's purpose and context of use, rather than selected one by one. Because the purpose of this study is not to grade a presenter's overall speaking ability holistically but to provide nonverbal behavior information that users can act on during training, the output unit is accordingly set to behavior categories. This direction is consistent with the feedback literature. Feedback improves performance on average, but the direction and size of its effects are inconsistent, and it works better when it directs the user's attention to the task level rather than to the self (Hattie and Timperley, 2007; Kluger and DeNisi, 1996).
From the specificity of output identified in automated public speaking feedback research, the accuracy–efficiency trade-off highlighted in skeleton-based action recognition research, and the generalization problem raised in user-independent evaluation research, three requirements follow for the behavior recognition model in this study. The first is behavior-level specificity. Instead of a holistic assessment of the presentation as a whole, the system should distinguish individual behaviors at a level the presenter can identify and correct (Hattie and Timperley, 2007; Tanveer et al., 2016), and it should indicate which behaviors are confused with one another. The second is generalization to new presenters. Examining performance on presenters not seen during training requires evaluation in which no person's data appear in both training and evaluation (Dehghani et al., 2019; Shahroudy et al., 2016). Because in real education and training settings the system is applied to new presenters, this study implements this requirement as speaker-independent evaluation. The third is deployment efficiency. Automated feedback systems for repeated presentation practice have aimed at real-time or scalable feedback (Ochoa et al., 2018; Tanveer et al., 2015), and skeleton-based action recognition research has sought to improve model complexity and inference efficiency along with accuracy (Song et al., 2020; Zhang et al., 2020). To examine feasibility for actual service deployment, this study evaluates model size and inference latency together with accuracy. These three requirements carry directly into the task formulation, data splits, choice of comparison models, and evaluation methods in Section III.
Ⅲ. Methods
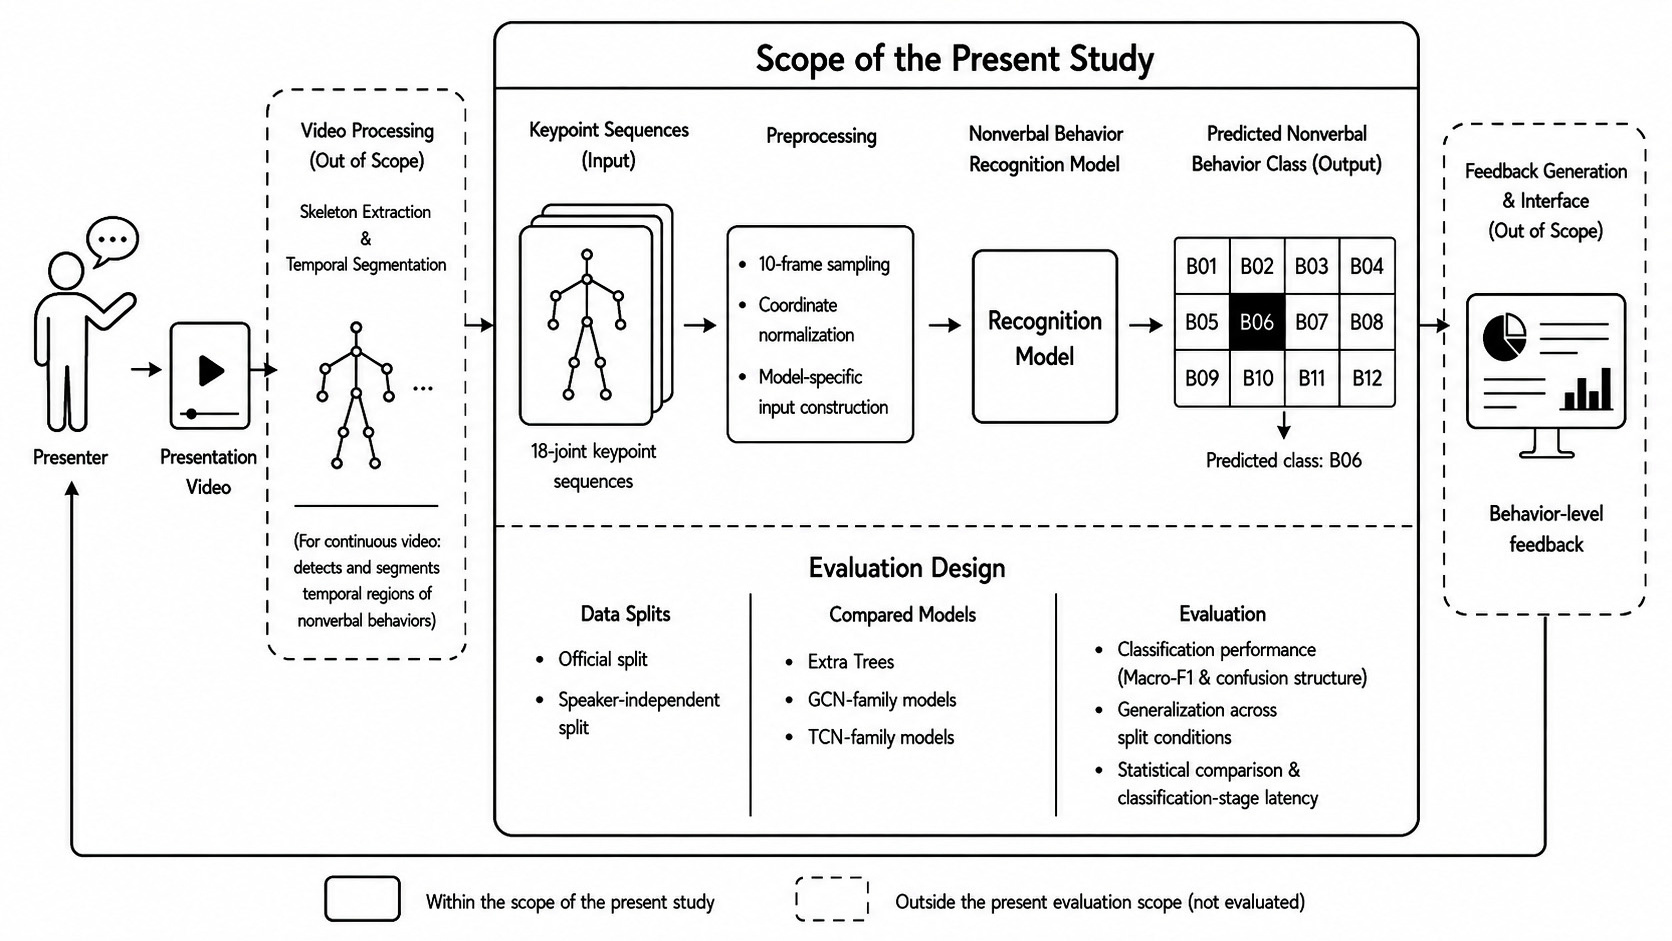
The overall approach and scope of this study are summarized in Figure 1. Skeleton keypoint sequences from the AI-Hub Public Speaking Practice and Evaluation Data are preprocessed into model inputs; performance is then examined under the official split and a speaker-independent split; five models spanning classical machine learning, GCN-family models, and TCN-family models are compared under a common data-split and evaluation framework; and the analyses cover 12-class classification performance, generalization across split conditions, statistical stability of model differences, confusion structure, and classification-stage latency. The figure also distinguishes the recognition component evaluated in this study from the full OPAF pipeline, for which skeleton extraction, temporal detection, feedback generation, and user interaction remain outside the present evaluation scope.
3.1 Data
This study analyzes the nonverbal keypoint labeling data of the "Public Speaking Practice and Evaluation Data" (National Information Society Agency, 2024) released by AI-Hub. The dataset was constructed for public-speaking practice and evaluation rather than for employment interviews. Its metadata define three presentation situations―explanation (S01), argumentation (S02), and pro/con (S03)―and provide skeleton keypoint labels for the presenter's nonverbal behavior together with presentation video, audio, presentation-material text, and presentation-assessment text. The empirical claims of this study are therefore limited to recognition of the labeled behaviors in a presentation context. Application to employment interviews is not tested here and requires separate validation with interview-specific data and users. According to the officially reported construction scale, the nonverbal source data comprise 288,000 items and the nonverbal labeling data comprise 28,800 items. The 12 behavior categories were not selected anew by this study. They constitute the complete B01–B12 gesture_type taxonomy listed in the official AI-Hub documentation for the Public Speaking Practice and Evaluation Data, which provides a definition for each class and reports 2,400 items per class (National Information Society Agency, 2024). This study therefore adopts the entire source taxonomy as its 12-class classification target rather than selecting a subset of behaviors. The public documentation, however, does not report a separate validation procedure explaining why exactly these 12 categories were chosen or whether they exhaust the range of undesirable presentation behaviors. Accordingly, the selection rationale is treated as a property of the source dataset, and the present study does not claim to have independently established the comprehensiveness or normative validity of the 12-category scheme. The nonverbal data consist of clips in which 800 presenters performed these predefined behavior categories, and the presenters' age groups are distributed across six brackets ranging from the third year of middle school to those in their fifties and above.
Among these, this study uses the nonverbal label JSON accessible in the open dataset. These data comprise 25,920 clips in total, stored as 23,040 directories in the training set and 2,880 in the validation set. The official documentation lists a separate test set of 2,880 items, but these are not included in the open dataset. These clips are derived from 799 presentation-unit identifiers, with the number of clips per identifier ranging from a minimum of 12 to a maximum of 36. Each frame is represented by 18 keypoints. The joint order in the open JSON is 0 nose, 1 left eye, 2 right eye, 3 left ear, 4 right ear, 5 neck, 6 left shoulder, 7 right shoulder, 8 left elbow, 9 right elbow, 10 left wrist, 11 right wrist, 12 left hip, 13 right hip, 14 left knee, 15 right knee, 16 left ankle, and 17 right ankle. Because this order differs from the index presented in the official documentation, this study defines the skeleton graph and the distance and angle features according to the joint order observed in the released JSON. The keypoint configuration and skeleton connection structure used in this study, together with an example of the labeled public-speaking data, are shown in Figure 2. The label of each clip is the gesture classification field (gesture_type) in the metadata, which takes 12 values from B01 to B12. The definitions of the 12 classes are given in Table 1. In the AI-Hub documentation, these B01–B12 categories are defined as gesture_type labels, while a separate gesture_eval field is provided for positive/negative/neutral evaluation; the intended data service is also described as a speaking-evaluation service based on a negative-gesture classification model (National Information Society Agency, 2024). In this study, the term “negative” follows this source-dataset designation and is used operationally for the 12 gesture_type categories. It should not be read as a claim that every occurrence of each movement is inherently or universally negative. The study treats gesture_type as the classification target and does not infer a presenter's psychological state or independently validate the audience-perceived valence of each class. Some class definitions in the source dataset include contextual conditions as well as observable movement descriptions. For example, B06 is defined in the AI-Hub documentation as shaking the head from side to side when speech is blocked or after a mistake (National Information Society Agency, 2024). Because the model in this study uses skeleton coordinates only and does not use speech or audio information, it can classify the observed head-movement pattern but cannot verify whether a speech error actually occurred. Thus, if a similar side-to-side head movement occurs without a speech error, the model may still predict B06 on the basis of motion similarity; such a prediction should not be interpreted as evidence that the presenter stumbled over words or reacted to a mistake. The study therefore interprets the output as a movement-category prediction, not as an inference about the cause or psychological meaning of the movement.
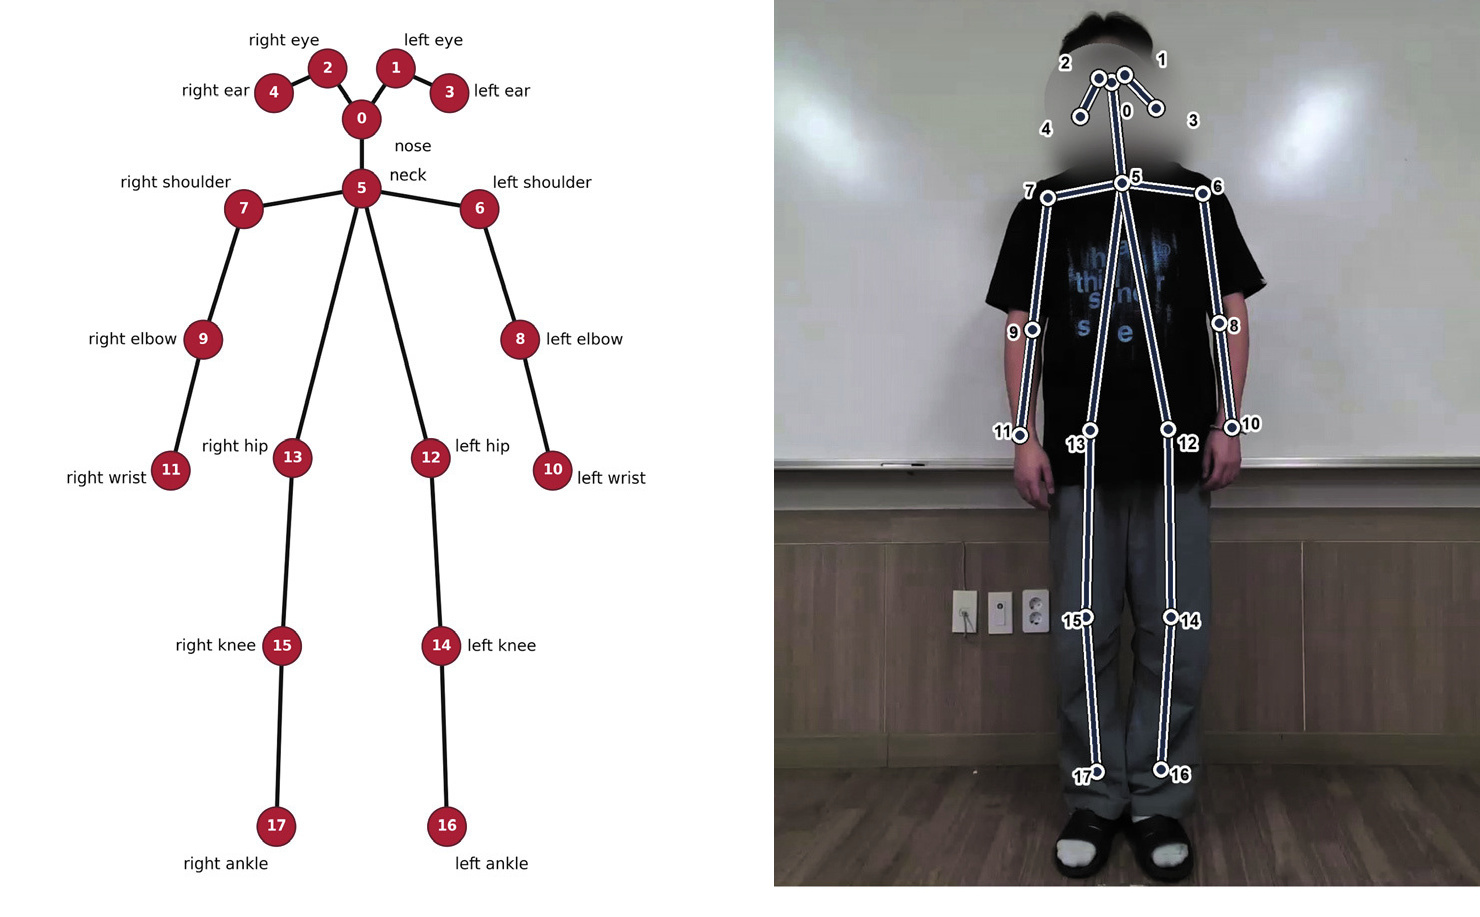
(a) The 18-keypoint skeleton structure (b) an example of the labeled public-speaking data
Note. Panel (b) is adapted from the Public Speaking Practice and Evaluation Data (National Information Society Agency, 2024).
<Table 1> Definitions of the 12 negative gesture classes
| Code | Body Region | Gesture | Definition |
|---|---|---|---|
| B01 | Hands | Hair touching | Touching one’s hair with a hand |
| B02 | Hands | Face touching | Touching one’s face with a hand |
| B03 | Hands | Body scratching | Scratching one’s body with a hand |
| B04 | Hands | Nail fidgeting | Fidgeting with one’s fingernails |
| B05 | Head | Head tossing | Tossing the head, for example, to flick back loose hair |
| B06 | Head | Head shaking | Shaking the head from side to side (defined in the source dataset in the context of stumbling over words or after a mistake) |
| B07 | Head | Head lowering | Keeping the head lowered |
| B08 | Arms | Hands behind back | Holding the hands behind the back |
| B09 | Arms | Aimless arm motion | Bending and extending the arms without purpose |
| B10 | Posture | Body swaying | Swaying the body from side to side |
| B11 | Posture | Slanted standing | Standing in a slanted posture |
| B12 | Posture | Body twisting | Twisting the body |
The task of this study is a classification problem that takes the three-dimensional keypoint sequence (x, y, z) of each clip as input and determines which of the 12 categories of movement the clip belongs to. This is distinct from detection or temporal segmentation, which locate the occurrence of a behavior within a continuous presentation video; because the data consist of clips that presenters performed following instructions, the results of this study are interpreted as classification performance under the condition of elicited and segmented clips.
3.2 Preprocessing
In this study, the keypoint sequence of each clip was fixed at a length of 10 frames. This follows the nonverbal model construction procedure presented by AI-Hub, in which 10 frames are sampled from the start to the end frame of each behavior (National Information Society Agency, 2024). Regardless of the original number of frames, 10 points were uniformly sampled across the entire interval. The overall flow of preprocessing and model input configuration is shown in Figure 3.
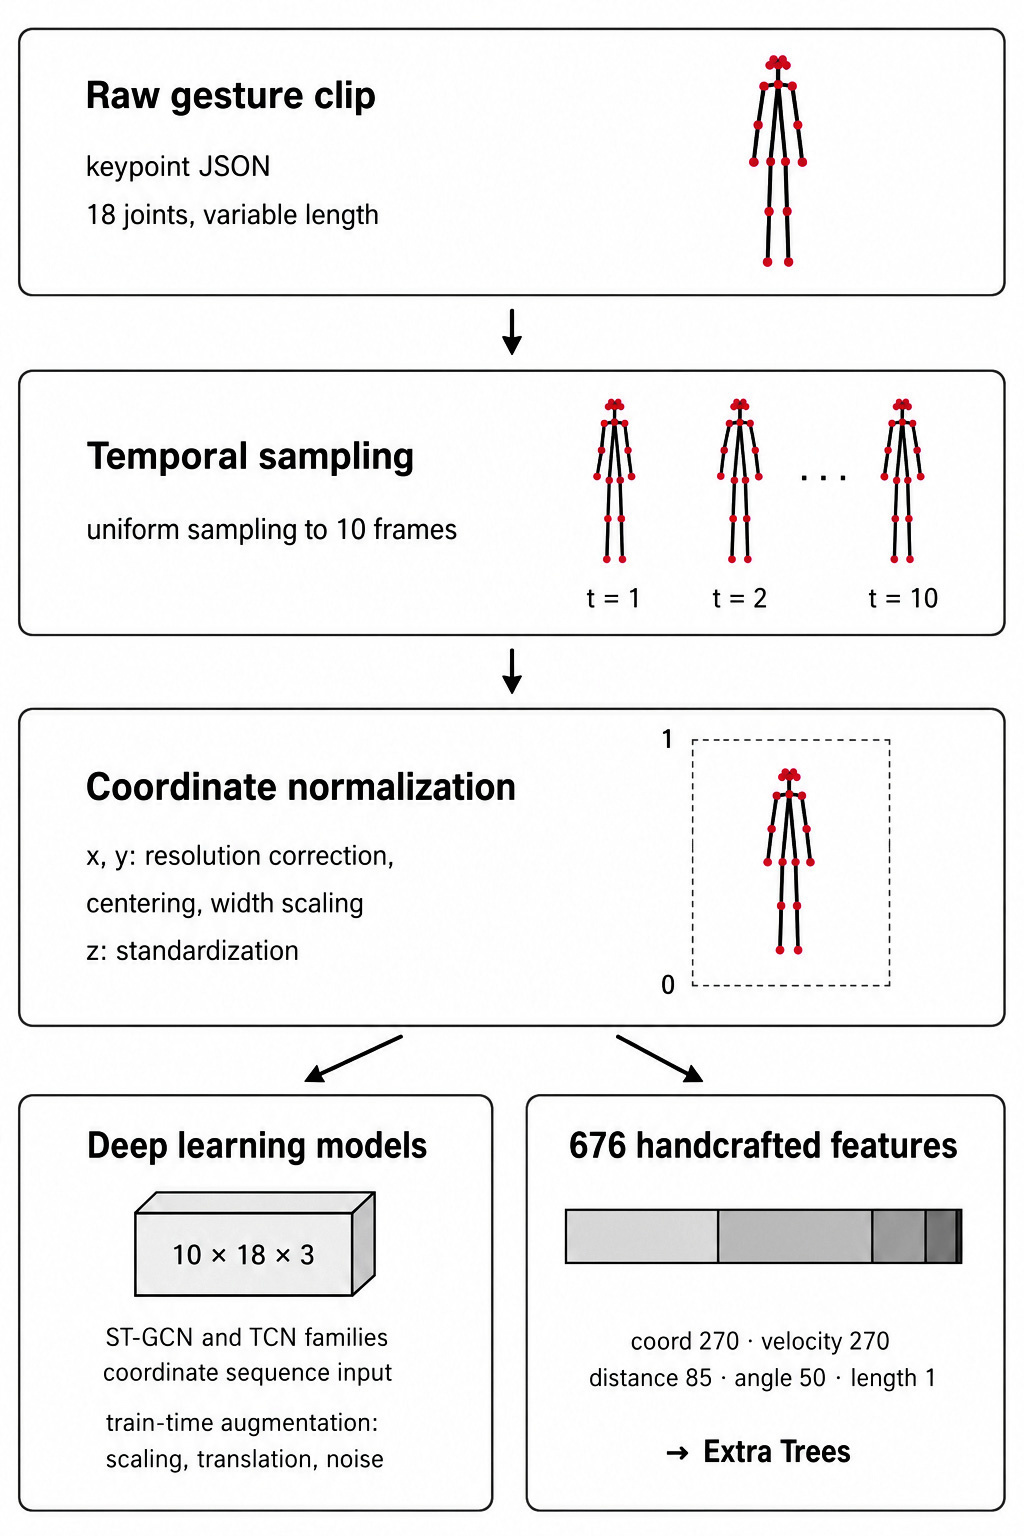
The joint coordinates were normalized before use, in order to remove differences in the presenter's on-screen position, physique, and video resolution. For the x and y coordinates, the resolution was corrected by dividing by the horizontal and vertical size of the video. Then, for each frame, the mean of the joint coordinates was subtracted to center them. Finally, they were normalized by dividing by the maximum width of the coordinate distribution within that frame. The z coordinate was normalized, for each frame, by subtracting the mean over the joints and dividing by the standard deviation.
Data augmentation was applied during the training of the deep-learning models, and was not applied to validation or inference. The augmentation consisted of scaling of the x and y coordinates, coordinate translation, and the addition of Gaussian noise. The augmentation strength was set to a noise standard deviation of 0.01, a scaling range of 0.03, and a translation standard deviation ranging from 0.005 to 0.01. Rotation and horizontal flipping were not used because the data include classes in which the left–right direction serves as a cue for distinguishing the movement category―such as shaking side to side or standing at an angle―so that such transformations could corrupt the labels.
For the classical machine-learning models, 676 features were extracted from the keypoint sequence. The features consist of 270 from five temporal statistics (mean, standard deviation, minimum, maximum, and range) of each three-dimensional coordinate of the 18 joints; 270 from the same statistics of the frame-to-frame velocity; 85 distance statistics for the 17 joint pairs following the body skeleton; 50 angle statistics for 10 joint triplets; and one for the sequence length. For the deep-learning models, no separate handcrafted features were used, and the keypoint coordinate sequence was input as is.
3.3 Data Splits
Generalization performance can be overestimated when clips from the same presenter enter both the training and validation data. This study therefore divides the data by two criteria with different levels of control over presenter overlap and presents the results for each. First, the official split, which uses the training and validation directory division of the AI-Hub open dataset as is, serves as an auxiliary criterion. It provides a reference performance that researchers who download the open dataset can reproduce. Second, the main results were produced under the speaker-independent split. After combining the training and validation portions of the open dataset, the data were divided by the presentation-unit identifier, with a split seed of 42, so that no identifier's clips would fall in both the training and validation data. The identifier used is the presentation-unit identifier (base_id), obtained by removing the gesture label and the repetition-round suffix from the file name. The base_id corresponds one-to-one with dataset.id in the metadata and has 799 unique values, effectively matching the official presenter count of 800. By contrast, the subject field in the metadata is a single constant value across all clips and therefore cannot distinguish presenters, and the person number in the file name is reused across age groups, so different presenters share the same number. For this reason, this study used the base_id as the presenter-unit identifier.
The composition of the two splits and the identifier overlap are shown in Table 2. In the official split, 220 of the 227 validation identifiers (about 97%) also appear in the training data, so validation performance is measured mostly on presenters who appeared in training; in contrast, the speaker-independent split has zero overlap under both identifier criteria. The validation data of the speaker-independent split comprise 5,220 clips, balanced at 435 per class.
<Table 2> Composition and identifier overlap of the official and speaker-independent splits
| Split | Training Clips | Validation Clips | Training Identifiers | Validation Identifiers | base_id Overlap | dataset.id Overlap |
|---|---|---|---|---|---|---|
| Official (directory) | 23,040 | 2,880 | 792 | 227 | 220 | 220 |
| Speaker-independent (seed 42) | 20,700 | 5,220 | 639 | 160 | 0 | 0 |
Beyond the zero overlap at the identifier level, we also checked whether any clip in the validation data duplicates a clip in the training data at the content level. A nearest-neighbor search between the training and validation data, based on the normalized keypoint sequences, found no exact or near-exact matches (L2 distance below 10⁻³). The speaker-independent split thus separates the training and validation data not only at the identifier level but also at the clip-content level.
We also controlled for the possibility that the performance difference between the two splits arises from a difference in training-data size. Because the 20,700 training clips of the speaker-independent split are about 10% fewer than the 23,040 of the official split, the training data of the official split were randomly subsampled to 1,725 clips per class, matching 20,700 in total, while the official validation data were left unchanged. This control condition, the speaker-independent split, and the full official split were all repeated with training seeds 7, 42, and 123.
Meanwhile, the presentation types (S01 explanation, S02 argumentation, S03 pro/con) all appear in both the training and validation data of the speaker-independent split, and the class distribution within each type is balanced, confirming that the split is not biased toward any particular presentation type.
3.4 Compared Models
This study compared one classical machine-learning model and four deep-learning models. The comparison models were selected along three axes. We contrasted classical machine learning based on human-designed features with deep learning that learns directly from the keypoint sequence; within deep learning, we included both the GCN family (ST-GCN, ST-GCN++) and the TCN family (Residual TCN, Distilled TCN); and for each family we included a large model and a lightweight model, so that the trade-off between accuracy and deployment efficiency could be examined. All models were evaluated on the same speaker-independent split under a common evaluation framework, and training was repeated with seeds 7, 42, and 123; the mean and standard deviation are reported. The configuration of the models is shown in Table 3.
<Table 3> Configurations of the Compared Models
| Model | Input | Parameters |
|---|---|---|
| Extra Trees | 676 handcrafted features | 250 trees |
| Tuned ST-GCN | Joint coordinates | 3,077,424 |
| ST-GCN++ Light+Topology | Joint coordinates | 408,184 |
| Residual TCN JBM | Joint, bone and motion (9 channels) | 2,804,748 |
| Distilled TCN | Joint coordinates | 443,788 |
Extra Trees (Geurts et al., 2006) takes as input the 676 handcrafted features described in Section III.2, and the number of trees and the number of features considered at each node split were tuned on the macro-F1 of the speaker-independent validation data. Tuned ST-GCN keeps the spatio-temporal block structure and the learnable edge-importance scheme of the standard ST-GCN (Yan et al., 2018), while aligning the skeleton graph with the 18-joint configuration of this dataset (Section III.1) and adjusting the regularization and the learning rate. ST-GCN++ Light+Topology is a variant that adds task-relevant joint connections to the adjacency matrix on top of a lightweight configuration of ST-GCN++ (Duan et al., 2022) with fewer blocks and narrower channels; its design drew on channel-wise topology refinement (Chen et al., 2021) and an efficient graph-convolution baseline (Song et al., 2020). Residual TCN JBM is a temporal convolutional network with residual connections (Bai et al., 2018) that takes as input a 9-channel representation combining joint coordinates, bone vectors (differences between adjacent joints), and motion (differences between adjacent frames). Distilled TCN is a lightweight temporal convolutional network trained with knowledge distillation (Hinton et al., 2015), with the Tuned ST-GCN trained under the same seed serving as the teacher model. The four deep-learning models shared the same training settings except for the learning rate and were trained for up to 40 epochs with the AdamW optimizer; for each model, the checkpoint with the highest validation macro-F1 during training was selected as its final model. In addition, Sections IV.2 and IV.5 use two reference models―ST-GCN++ without the dataset-specific adjustments, and a plain TCN without the residual connections and the joint–bone–motion input―only to gauge the effects of tuning and of the split conditions.
3.5 Evaluation Methods
The main evaluation metric of this study is the macro-F1 over the 12 classes. The macro-F1 computes the F1 of each class individually and then takes a simple average irrespective of the number of samples per class, so the 12 gestures are weighted equally. The ground truth is the gesture-type (gesture_type) label assigned by AI-Hub. The speaker-independent validation data are balanced at 435 clips per class, and in practice the difference between top-1 accuracy and macro-F1 was below 0.1 percentage points for all models. Because the two metrics provide essentially the same information, only the macro-F1 is reported in the tables.
Table 4 maps each evaluation purpose to what is measured and to the corresponding metric or statistical method. The table also distinguishes model-classification latency from end-to-end system latency so that the scope and interpretation of the analyses reported in Section IV are explicit.
<Table 4> What each evaluation method measures
| Evaluation purpose | What is measured | Metric / Method |
|---|---|---|
| 12-class classification performance | Average class-wise classification performance on presenters unseen during training | Macro-F1 over the 12 classes; mean ± SD over three training seeds |
| Generalization to new presenters | Performance difference associated with presenter overlap and split configuration | Macro-F1 under the speaker-independent and official splits; training-size-controlled condition; identifier- and content-level overlap checks |
| Statistical stability of model differences | Whether pairwise model differences are stable across presenters | Presenter-level Wilcoxon signed-rank test; clip-level McNemar exact test; Holm correction; presenter-level bootstrap 95% CI (2,000 resamplings); tests based on seed-42 predictions |
| Error structure | Which classes are confused and where errors concentrate | Per-class F1; row-normalized confusion matrix; within-body-part misclassification rate |
| Deployment efficiency | Efficiency of the classification stage, not end-to-end system latency | Parameter count; median single-clip inference latency under single-thread, batch-size-1 CPU conditions; comparison with the 33.3 ms reference budget at 30 fps; skeleton extraction and temporal segmentation excluded |
Because the clips in the validation data are clustered by presenter (160 presenters, 5,220 clips), the confidence interval of the macro-F1 was computed with the percentile method over 2,000 presenter-level bootstrap resamplings (Efron and Tibshirani, 1993). For performance differences between models, the main test was the two-sided Wilcoxon signed-rank test on the presenter-level accuracy differences (Wilcoxon, 1945), and the clip-level McNemar exact test (McNemar, 1947) was conducted in parallel. The p-values of the seven pre-planned comparisons were then adjusted for multiple comparisons with the Holm method (Holm, 1979). The predictions of the representative seed 42 were used for the tests.
Deployment efficiency was evaluated by the inference latency of the classification stage. Excluding skeleton extraction and temporal segmentation from the measurement scope, we report the median of 200 single-clip measurements after 20 warm-up runs, on an AMD Ryzen 9 9900X CPU under single-thread, batch-size-1 conditions. The deep-learning models were each measured in PyTorch and in ONNX Runtime, the deployment format, and the ONNX-converted models were confirmed to match the PyTorch outputs and predictions on the validation clips. To judge real-time capability, we used 33.3 ms per clip as the reference line, corresponding to 30 fps, the acquisition frame rate of the input video (Zhang, 2012), following the convention that processing 30 or more frames per second counts as real time (Redmon et al., 2016).
Ⅳ. Results
All experiments were performed with Python 3.10, PyTorch 2.5.1, and ONNX Runtime 1.23.2, and an NVIDIA GeForce RTX 3090 was used for the training and GPU inference of the deep-learning models. The results in this section were obtained under the speaker-independent split and, unless otherwise noted, are reported as the mean and standard deviation over training seeds 7, 42, and 123.
4.1 12-Class Gesture Classification Performance
Under the speaker-independent split, the macro-F1 of the four deep-learning models clustered between 89.9% and 90.8%. Tuned ST-GCN was highest at 90.75% and Distilled TCN lowest at 89.91%, a spread of 0.8 percentage points. The two lightweight models with about 400,000 parameters, ST-GCN++ Light+Topology (90.29%) and Distilled TCN (89.91%), stayed within 0.4 to 0.8 percentage points of Tuned ST-GCN (90.75%) and Residual TCN JBM (90.68%), which have more than seven times as many parameters.
Extra Trees, the classical machine-learning model, reached a macro-F1 of 89.00% under the same speaker-independent split, about 0.9 percentage points below the lowest deep-learning model. Human-designed posture and statistical features alone thus reached the 89% level, but the deep-learning models that learn directly from the keypoint sequence consistently outperformed it. The performance of the five models is shown in Table 5. The statistical significance of the difference between the two approaches is examined in Section IV.2, and the classes in which the difference concentrates in Section IV.3.
<Table 5> Performance of 12-Class Gesture Classification on the Speaker-Independent Split
| Model | Parameters | Macro-F1 (%) |
|---|---|---|
| Tuned ST-GCN | 3,077,424 | 90.75 ± 0.35 |
| Residual TCN JBM | 2,804,748 | 90.68 ± 0.15 |
| ST-GCN++ Light+Topology | 408,184 | 90.29 ± 0.07 |
| Distilled TCN | 443,788 | 89.91 ± 0.37 |
| Extra Trees | 250 trees | 89.00 ± 0.08 |
4.2 Statistical Stability of Model Differences
To check that the performance differences between models do not depend on a particular sample, we computed presenter-level paired tests and bootstrap confidence intervals on the same validation data (160 presenters, 5,220 clips). The main comparisons are shown in Table 6.
<Table 6> Presenter-Level Wilcoxon Signed-Rank Tests of Pairwise Model Differences
| Comparison (A vs. B) | Presenters with Higher Accuracy for A | Presenters with Higher Accuracy for B | Presenters with Equal Accuracy | p-value |
|---|---|---|---|---|
| Extra Trees vs. Distilled TCN | 51 | 77 | 32 | 0.011 |
| Extra Trees vs. ST-GCN++ Light+Topology | 46 | 71 | 43 | 0.005 |
| Extra Trees vs. Residual TCN JBM | 47 | 79 | 34 | 0.002 |
| Extra Trees vs. Tuned ST-GCN | 37 | 86 | 37 | 9.9×10⁻⁷ |
| ST-GCN++ Baseline vs. Tuned ST-GCN | 37 | 67 | 56 | 4.2×10⁻⁴ |
| Tuned ST-GCN vs. Distilled TCN | 67 | 45 | 48 | 0.019 |
| Tuned ST-GCN vs. ST-GCN++ Light+Topology | 63 | 43 | 54 | 0.010 |
In the Wilcoxon signed-rank tests, all four deep-learning models were significantly better than the hyperparameter-tuned Extra Trees. Even the lowest, Distilled TCN, outperformed it (p = 0.011), and the difference was largest for the highest, Tuned ST-GCN (p = 9.9×10⁻⁷). In all four comparisons, more presenters had higher accuracy with the deep-learning model, and the clip-level McNemar exact tests led to the same conclusions. The differences themselves were modest, however, ranging from 0.9 to 1.8 percentage points. The presenter-level confidence interval of Extra Trees (about 0.876 to 0.904) overlapped with those of the deep-learning models, but in the paired comparisons within the same presenters, all four deep-learning models were consistently higher. That is, the difference between a well-tuned classical baseline and deep learning is consistently detected in paired comparisons, but its magnitude is smaller than the performance variation across presenters.
Small differences were also detected among the deep-learning models. Tuned ST-GCN, the highest, was significantly higher than the untuned ST-GCN++ baseline (p = 4.2×10⁻⁴) and than the two lightweight models, Distilled TCN (p = 0.019) and ST-GCN++ Light+Topology (p = 0.010). These differences were small, however: in the presenter-level bootstrap, the top four models shared an overlapping interval (macro-F1 of about 0.899 to 0.915). The two large models, Tuned ST-GCN and Residual TCN JBM, had largely overlapping confidence intervals and were not distinguishable from each other. Significance was maintained in all comparisons in Table 6 after the Holm correction.
The comparison with classical machine learning and the comparisons among the deep-learning models carry different implications for model selection. Because the four deep-learning models consistently and significantly outperformed the hyperparameter-tuned Extra Trees, the case for adopting classical machine learning instead is limited even when a lightweight model is chosen for deployment efficiency. Among the deep-learning models, the largest, Tuned ST-GCN, performed best, and its advantages over the two lightweight models were small but statistically detectable. Lightweight deployment is therefore not free of accuracy loss: it trades less than one percentage point of accuracy for inference efficiency, though a difference of this size is unlikely to be decisive in practice.
4.3 Per-Class Performance and Confusion Structure
We analyzed the per-class performance and the confusion matrix of the representative deep-learning model, Tuned ST-GCN (seed 42), to check whether the classification performance is skewed toward particular classes. Following the dataset definitions, the 12 classes were examined in four body-part groups: hands (B01–B04), head (B05–B07), arms (B08–B09), and posture (B10–B12). This analysis describes classification results for the observed movement labels only and does not interpret the psychological meaning of the movements. The confusion matrix is shown in Figure 4.
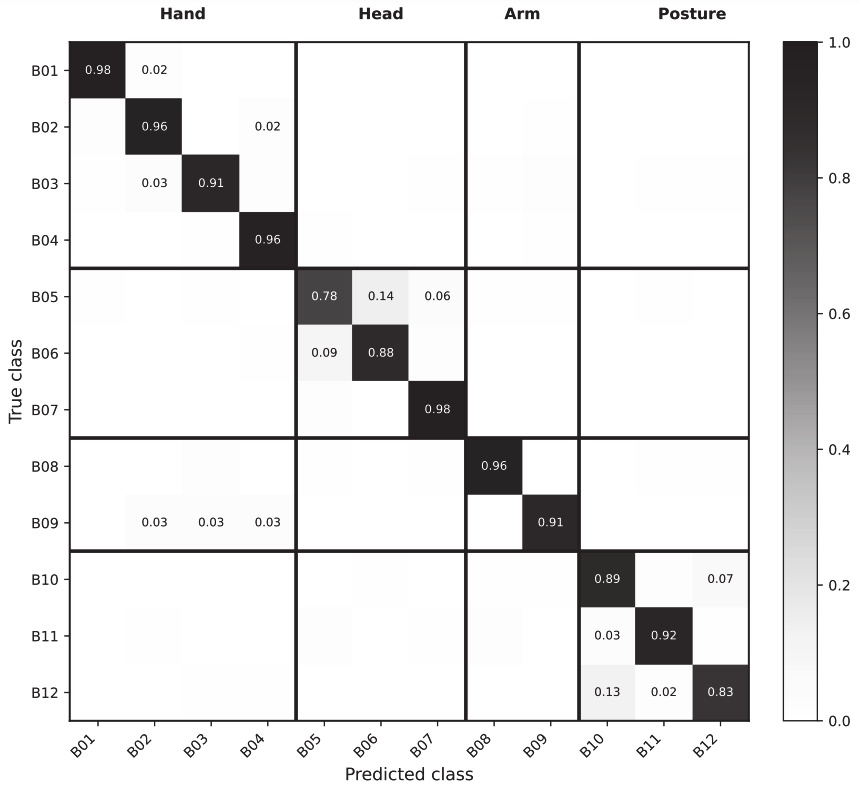
Per-class F1 ranged from 0.81 to 0.97, so performance was not concentrated in a few classes. The lowest were the head movement B05 (head tossing, F1 0.81) and the posture movement B12 (body twisting, F1 0.86).
Of the 459 total misclassifications, 68.4% occurred within the same body-part group. Among the head movements, B05 and B06 were confused with each other (B05→B06 14.0%, B06→B05 9.4%), giving the head group the highest within-group misclassification rate at 88.0%. Among the posture movements, B12 was misclassified as B10 in 13.1% of cases and B10 as B12 in 7.1%, so the two postures were mutually confused. The arm movement B09 was never confused with B08 in the same group but was misclassified into the hand movements B02 through B04 at about 3% each, apparently because bending and extending the arms without purpose is accompanied by changes in hand position. In short, performance was not skewed toward particular classes, and the misclassifications were concentrated in kinematically similar movement pairs.
4.4 Deployment Efficiency
This section reports the deployment efficiency of the classification stage. Latency was measured following the protocol in Section III.5, and the latency of each model is shown in Table 7. As deployment candidates, the lightweight deep-learning models were superior to classical machine learning in both accuracy and inference speed. Distilled TCN had a macro-F1 about 0.9 percentage points higher than Extra Trees, while its single-clip CPU latency from keypoints to prediction was 0.13 ms in ONNX, roughly one-thirtieth of Extra Trees' 3.96 ms. Because the latency of Extra Trees comes mostly from tree inference and extracting the 676 features takes only about 0.25 ms, the latency difference between the two models stems from the inference method rather than from feature extraction.
<Table 7> Single-Clip Inference Latency of the Classification Stage
| Model | CPU (ms) | ONNX CPU (ms) | Margin over the Real-Time Budget (33.3 ms) |
|---|---|---|---|
| Distilled TCN | 0.66 | 0.13 | ≈257× |
| ST-GCN++ Light+Topology | — | 0.83 | ≈40× |
| Tuned ST-GCN | — | 3.17 | ≈11× |
| Extra Trees | 3.96 | — | ≈8× |
Note. Deep-learning models were measured in PyTorch and ONNX Runtime; Extra Trees was measured in scikit-learn, and its latency includes feature extraction (approximately 0.25 ms).
Conversion to ONNX Runtime, the deployment format, reduced latency by a factor of about four to five relative to PyTorch. As a result, the single-thread classification latencies of the two lightweight models left margins of about 257× (Distilled TCN, 0.13 ms) and about 40× (ST-GCN++ Light+Topology, 0.83 ms) relative to the 33.3 ms real-time budget at 30 fps. Compared with the best-performing model, Tuned ST-GCN, the two lightweight models reduced the number of parameters by about 86% while shortening the ONNX classification latency by about 96% and 74%, respectively, with the macro-F1 differences remaining at 0.84 and 0.46 percentage points. The two lightweight models also ran faster on CPU than on GPU (for Distilled TCN, 0.13 ms in ONNX on CPU versus 1.27 ms on GPU), apparently because kernel-launch overhead exceeds computation time when the model is small. This shows that the classification stage operates far below the real-time budget on a single CPU core, without a dedicated accelerator. In other words, the classification stage is not the bottleneck for real-time feedback; the real-time capability of the entire pipeline, including skeleton extraction, remains to be verified separately at the system implementation stage.
4.5 Comparison with the Official Split
This section examines the validity of the speaker-independent split by comparing performance across the two splits under the same models and training conditions. The official split yielded a macro-F1 2.4 to 2.6 percentage points higher than the speaker-independent split, and this direction held across both reference models and all three training seeds. By the base_id criterion, the official split contains 220 overlapping identifiers whose clips appear in both the training and validation data; the speaker-independent split eliminates this overlap. The higher performance of the official split suggests that performance can be overestimated in an evaluation with presenter overlap. In fact, even within the same validation data of a model trained on the official split, clips from presenters who appeared in training (2,748 clips) showed an accuracy 0.4 to 2.9 percentage points higher than clips from presenters who did not (132 clips), across both reference models and all three training seeds. The comparison of the two splits is shown in Table 8.
<Table 8> Macro-F1 (%) of the Official and Speaker-Independent Splits
| Model | Official | Speaker-Independent | Difference | Official, Size-Controlled |
|---|---|---|---|---|
| ST-GCN++ Baseline | 91.70 | 89.31 | 2.39 | 91.04 |
| TCN Baseline | 90.02 | 87.39 | 2.63 | 89.71 |
We also controlled for the possibility that this difference stems from the smaller training-data size. Because the 20,700 training clips of the speaker-independent split are about 10% fewer than the 23,040 of the official split, the training data of the official split were randomly subsampled to 1,725 clips per class (sampling seed fixed at 42), matching the 20,700 total, while the official validation data were left unchanged. Macro-F1 remained at 91.04% for the ST-GCN++ baseline and 89.71% for the TCN baseline, so the size reduction accounts for only about 0.3 to 0.7 percentage points, and this pattern also held across both reference models and all three training seeds. That is, most of the difference between the official and speaker-independent splits is not explained by data size. The difference attributable to split configuration (2.4 to 2.6 percentage points) is larger than the difference between model families confirmed in Sections IV.1 and IV.2 (0.9 to 1.8 percentage points). In this task, therefore, the composition of the evaluation split has a greater effect on the reported performance figures than the choice of model.
Ⅴ. Conclusion and Implications
5.1 Summary of Findings
This study developed and evaluated a model that automatically recognizes 12 categories of negative gestures in presentations, using AI-Hub's Public Speaking Practice and Evaluation Data. The model is the recognition component on which behavior-specific feedback can be built, not a full feedback system. Moving away from approaches that evaluate presenter behavior only with holistic scores, the study focused on recognizing fine-grained units of nonverbal behavior that presenters can actually correct. The aim was to examine whether, in presentation education and organizational communication training, AI can serve not merely as a scoring instrument but as a learning-support tool that provides specific feedback.
The deep-learning skeleton models maintained stable classification performance even under speaker-independent evaluation. The hyperparameter-tuned Extra Trees formed a baseline at the 89% level, but the four deep-learning models that learn directly from the skeleton sequence all significantly outperformed it. The differences were below 2 percentage points, however. Human-designed summary statistics alone thus capture much of the nonverbal behavior, while learning the spatio-temporal structure of the skeleton sequence directly yields a small but consistent additional gain.
The best-performing model was a large deep-learning model, but the lightweight deep-learning models stayed within one percentage point of it in accuracy, a difference that was statistically detectable but small. In designing an actual OPAF, a large model may be used for maximum accuracy, but trading a small amount of accuracy for response speed and operational efficiency with a lightweight model can be a reasonable choice. Systems used in presentation education and organizational training must combine high accuracy with fast response, low operating cost, and stable deployability. In this study, the lightweight deep-learning models kept sufficient classification performance despite their small size and showed processing efficiency applicable, at the classification stage, to a real-time feedback system.
In the per-class analysis, most gestures were classified fairly evenly, but some errors concentrated between kinematically similar behaviors. Behaviors that share a body part and a direction of movement, such as head movements or postural swaying, were more likely to be confused with each other. The model's errors did not occur at random; they arose mainly in similar behavior categories that human observers may also find difficult to distinguish. Future system development will therefore need finer criteria for distinguishing similar gestures, or a multimodal approach that draws on video, audio, and contextual information together.
Finally, the comparison between the official and speaker-independent splits confirmed that performance can be estimated above the true generalization level when clips from the same presenter appear in both the training and validation data. The difference due to split configuration (2.4 to 2.6 percentage points) was larger than the difference between model families (0.9 to 1.8 percentage points). Validation-set performance alone is therefore not a sufficient basis for judging the effectiveness of an OPAF in education or organizational training. What is needed is an evaluation design that examines whether the model works reliably for new users, new presenters, and new presentation situations.
5.2 Implications
It has been pointed out that AI research in management studies has not sufficiently addressed applied topics from industry (Yoon et al., 2025). This study examined one such topic, the recognition of nonverbal behavior in presentations, from the perspective of competency development for organizational members. For management research and practice, the findings inform two decisions involved in adopting AI-based training tools. First is the validity of performance evidence: the comparison between the official and speaker-independent splits shows that reported performance changes when presenter overlap is removed, indicating that organizations and researchers should examine generalization to new users rather than relying only on performance from a released split. Second is the deployment trade-off: the lightweight models retained classification performance close to the best model while reducing classification-stage latency and model size. This result informs model-selection decisions for scalable training services, while end-to-end responsiveness and user benefits remain to be validated separately. In this sense, the study connects evaluation design and model selection to managerial questions of evidence validity, scalability, and deployment cost in human-resource development. The academic implications are as follows.
First, the study reframes the target of OPAFs from holistic score prediction toward fine-grained behavioral feedback, by formulating the recognition of correctable nonverbal behaviors as a classification task. Existing OPAFs have largely summarized presenter performance as scores, grades, overall impressions, speaking rate, or gaze ratios―useful for gauging overall level, but limited in telling users which behaviors to correct and how. By using the 12 negative-gesture tags as provided, this study detects presenters' nonverbal behavior at a finer unit and presents the possibility of linking it to specific feedback items.
Second, the study examined the generalization of nonverbal behavior recognition models more strictly through speaker-independent evaluation. In research based on open datasets, model performance can be overestimated when the same person or similar clips appear in both training and validation. Taking this into account, this study constructed a split in which no presenter's clips appear in both the training and validation data. This offers a more realistic criterion for evaluating whether a model works reliably for new users in actual education and training settings.
The practical implications are as follows. First, the study presents a technical foundation for AI-based competency assessment usable in management education and organizational communication training. Presentations, reports, proposals, interviews, and leadership communication are performance competencies demanded repeatedly in management practice, and they are difficult to improve through lecture-style instruction alone; they require repeated practice and feedback. This study developed a model that automatically recognizes presenters' nonverbal behavior. AI can thereby serve in business communication education and corporate training as a tool that identifies recurring behaviors and suggests directions for improvement, in line with the broader effort to apply artificial intelligence across human resource management, including recruitment and training (Park and Yang, 2020).
From an organizational perspective, behavior-level recognition has two immediate implications for training-system design. First, it can increase the actionability of feedback by providing identifiable behavior categories that can be linked to specific guidance rather than only a summary score. Second, automated recognition can apply the same classification rule repeatedly across users, making it a potentially scalable component for presentation and communication training in settings where repeated expert observation is costly. These implications concern the specificity and scalability of the recognition component; the present study does not establish that automated feedback is superior to human feedback or that it produces training transfer. In selection-related settings, prior research shows that applicants' nonverbal cues and self-presentation behaviors can influence interviewers' judgments (Barrick et al., 2009; DeGroot and Motowidlo, 1999). We cite this literature to establish the managerial relevance of nonverbal behavior, not to treat the 12 categories in this study as hiring criteria. Their use in interview training requires separate validation with interview data and users.
Second, the study considered model performance and deployment efficiency together. Performing well in a laboratory setting is not enough for an OPAF; application to actual classes, corporate training, online learning platforms, and interview training systems requires fast response and low operating cost. This study confirmed that a lightweight deep-learning model can retain sufficient accuracy while achieving, at the classification stage, processing efficiency applicable to a real-time feedback system. Its practical significance lies in having examined the conditions for securing service responsiveness and quality at low computational cost in digital service environments that must deliver immediate feedback to many users, such as online learning platforms and remote presentation training services.
The results can be applied most immediately in university presentation education and on online learning platforms. Presentation skills improve through repeated performance and immediate feedback, but instructors face time constraints in repeatedly observing every user's behavior and providing detailed feedback. The nonverbal behavior recognition model in this study can support self-directed improvement by letting users see, after a practice session, which negative gestures recur. The lightweight model showed high processing efficiency at the classification stage. Once combined with skeleton extraction and a feedback interface, it could therefore serve as a component of remote presentation training services, such as online learning management systems or videoconferencing-based instruction. The same recognition approach may also be examined in adjacent training contexts such as new-employee training, leadership development, and interview preparation. Prior virtual-human systems for interview and social-skills coaching (Anderson et al., 2013; Hoque et al., 2013) illustrate a possible implementation context for behavior-level feedback, but application of the present 12-category model to interviews requires interview-specific data and external validation before deployment. Such use presupposes a training aid, not an instrument of judgment. Nonverbal behavior varies with culture, individual characteristics, situational tension, and disability, so caution is warranted before using it as a direct criterion for hiring or personnel evaluation. In particular, the present study uses a public-speaking dataset constructed and evaluated in a Korean context, so the recognition performance and the meaning attached to the 12 behavior categories cannot be assumed to transfer unchanged to non-Korean presenters. Although the model uses skeletal joint coordinates rather than raw visual appearance, the motion patterns learned from the data and the behavioral taxonomy itself may still be culture-dependent. Cross-cultural use therefore requires external validation of both recognition performance and the interpretation of the behavior categories, including their designation as negative (Matsumoto, 2006). The model in this study is properly understood not as an evaluator that replaces people but as a feedback aid that helps users inspect and improve their own behavior.
5.3 Limitations and Future Research
This study has several limitations.
First, it addresses closed-set classification of pre-segmented, instructed gesture clips rather than detection in continuous video: every clip is assigned to one of the 12 categories, whereas in real presentations gestures lack clear boundaries, co-occur, and include movements outside these categories, and instructed clips may differ from spontaneous behavior. Future research should extend the model to temporal detection on naturally occurring presentation video and test whether the same tag scheme holds there.
Second, only nonverbal skeleton information was used; verbal content, vocal delivery, audience response, and presentation materials were not analyzed. Future research should extend the skeleton-based model into a multimodal OPAF that incorporates audio, transcribed text, and analysis of presentation materials.
Third, the presenter identifier was derived from file names because the open dataset lacks participant-level metadata. It effectively matches the official presenter count and prevents overlap between training and validation, but stricter verification is not possible without a separate participant table; future open datasets should specify presenter-level identifiers, recording conditions, and repetition information more clearly.
Fourth, the final-epoch selection for the deep-learning models and the hyperparameter tuning of Extra Trees used the same validation data reported for performance, so absolute performance may be somewhat optimistic. The difference due to epoch selection was within 0.25 percentage points across all models and seeds, however, and the same procedure was applied to every model, so the direction of the model comparisons is largely unaffected.
Fifth, latency was measured only for the classification stage, not for the full pipeline of video input, person detection, skeleton extraction, gesture segmentation, behavior classification, and feedback generation. The results therefore indicate the real-time potential of the classification model itself rather than of the whole system, and the cost analysis is likewise limited to that stage. Future research should verify the speed and stability of the full pipeline on low-end devices and in web and mobile environments.
Sixth, the AI-Hub gesture_type labels were treated as the ground truth for the classification task, but this study did not independently verify whether each of the 12 behaviors is perceived negatively by audiences or interviewers. The source documentation provides the behavior taxonomy and a negative-gesture evaluation context, but this does not establish that every occurrence of each movement is universally negative. Future research should therefore conduct evaluator studies in which each behavior category, including naturally occurring examples, is rated for perceived appropriateness or negativity across presentation and interview contexts, and should examine whether these judgments vary across evaluators and cultural groups. The confusion between B05 and B06 and between B10 and B12 in Section IV.3 suggests that boundaries between kinematically similar movements may be ambiguous at the labeling stage as well, and the effect of annotation quality on the interpretation of performance warrants follow-up research.
Finally, the study shows that the 12 negative gestures can be recognized automatically but does not establish that such feedback improves presentation ability; that a system can detect a behavior and that its feedback benefits a learner are different questions. Future research should compare learners who do and do not receive AI-based feedback, examining changes in presentation confidence, delivery, audience evaluation, learning satisfaction, and organizational communication competency, thereby testing whether AI-based oral presentation feedback is not only technically feasible but also educationally effective.
A separate user study is also needed to evaluate the feedback system built on this recognition component. Such research should first validate the model on naturally occurring presentation or interview data and then examine whether behavior-level feedback is understandable, usable, and actionable for actual users. Controlled comparisons can subsequently test whether receiving the feedback improves presentation behavior, audience evaluations, or learning outcomes relative to appropriate comparison conditions. These user- and evaluator-level questions are treated as follow-up validation rather than as outcomes established by the present classification study.
Building on these limitations, future research should proceed in six directions: (1) extend clip-level classification to temporal detection and recognition on naturally occurring, continuous presentation video; (2) integrate audio, transcribed speech, and presentation-material information into a multimodal OPAF; (3) verify end-to-end latency and stability, including skeleton extraction, temporal detection, classification, and feedback generation, on low-end, web, and mobile environments; (4) conduct external validation with presenters from different cultural backgrounds to test both recognition performance and the transferability of the behavior taxonomy; (5) conduct evaluator studies to examine whether each of the 12 categories is actually perceived as negative or inappropriate across presentation and interview contexts; and (6) conduct user studies and controlled comparisons to assess the usability, actionability, and learning effects of behavior-level AI feedback. Interview-specific application should be evaluated with interview data rather than inferred from the present presentation dataset.
Author Biographies
∙ Joonseok Kim is currently enrolled in the integrated master's and doctoral program in Management Information Systems (MIS) at the School of Business Administration, Kyungpook National University. He received his B.S. degree from the School of Computer Science and Engineering at the same university and conducts artificial intelligence–based research in the field of management information systems. His research interests include artificial intelligence, information security, computer vision, video-based action recognition, and the performance evaluation and practical application of AI models.
∙ Yeohoon Yoon is currently a master's student in the School of Business Administration at Kyungpook National University. He received his bachelor's degree in Statistics from Kyungpook National University. His research interests include data analytics, artificial intelligence, management information systems, and the analysis of user behavior using AI-based methods.
∙ Saerom Lee is a professor in the School of Business Administration at Kyungpook National University. She received her B.S. in International Trade from Pusan National University and Ph.D. in Management Information Systems from Seoul National University. Her research interests include open collaboration, e-WOM, web data analytics, and online deviant behavior.