
.jpeg)
젊은 최고경영자와 주식 고평가에 대한 R&D 대응: 한국 기업을 중심으로
Young CEOs and the R&D Response to Stock Overvaluation: Evidence from Korea
* 경북대학교, 경영학부 (Kyungpook National University, School of Business Administration)
DOI: https://doi.org/10.17287/kmr.2026.55.3.1435
Abstract
This study uses a sample of Korean listed firms from 2012 to 2022 to investigate whether younger CEOs respond more strongly to stock overvaluation in their corporate R&D investment decisions. The results indicate that stock overvaluation is positively correlated with R&D investment, with this relationship significantly stronger in firms led by younger CEOs. These findings remain robust across various alternative specifications and endogeneity checks. Further analyses do not provide compelling evidence that the equity financing channel primarily explains the observed relationship. Rather, the overall pattern of evidence aligns more with a catering-based interpretation. In particular, the R&D response to stock overvaluation is stronger in firms with a higher presence of short-horizon investors, implying that R&D investment may partially reflect managerial responses to stock market signals during periods of overvaluation. Overall, the findings indicate that the real effects of stock overvaluation depend on managerial interpretation. This study contributes to the literature on behavioral corporate finance and corporate innovation by highlighting the role of CEO age in shaping firms’ responses to stock overvaluation.
Ⅰ. Introduction
The Q theory of investment indicates that stock prices reflect a firm’s growth opportunities (Dong et al., 2021). Specifically, a higher Tobin’s Q indicates more favorable investment prospects, prompting firms to adjust their investment accordingly (Tobin, 1969). However, stock prices are not always aligned with a firm’s fundamentals because they can be skewed by investor sentiment or biased interpretations of public information, resulting in stock overvaluation. In such instances, chief executive officers (CEOs) may interpret inflated stock prices as indicators of investment opportunities, resulting in investments that lack economic justification (Polk and Sapienza, 2009). This issue is especially pertinent in the research and development (R&D) context, which is essential for long-term growth but difficult to evaluate due to its uncertainty and intangibility (Dong et al., 2021; Li, 2026). Because of the frequent insufficiency of internal assessments in informing R&D decisions, CEOs may integrate external cues, such as stock prices, with internal data (Bond et al., 2012; Chen et al., 2007; Foucault and Frésard, 2012; Kau et al., 2008). When stock prices are overvalued, this reliance may lead to R&D investment decisions that are not substantiated by the firm’s underlying fundamentals.
Stock overvaluation can compel a CEO to choose between satisfying heightened market expectations and adopting a more cautious strategy amid prevailing uncertainty. The catering hypothesis posits that CEOs may increase their investments to reinforce investor optimism regarding firm prospects (Alzahrani and Rao, 2014; Dong et al., 2021; Jensen, 2005; Jin, 2022; Kusnadi and Wei, 2017; Polk and Sapienza, 2009). This perspective indicates that CEOs deliberately amplify visible, growth-oriented investments, such as R&D, to satisfy perceived market expectations. However, the risk-aversion perspective provides an alternative viewpoint, asserting that CEOs adopt a more conservative approach in response to overvaluation (Luo et al., 2022). From this perspective, they may abstain from undertaking long-term projects such as R&D initiatives to evade potential criticism should market sentiment later reverse (Schwartz and Zozaya-Gorostiza, 2003). Therefore, this perspective implies that stock overvaluation may deter rather than promote R&D investment. These contrasting perspectives indicate that the trajectory of the R&D response to stock overvaluation is ultimately an empirical question.
Individual characteristics, particularly age, may influence differences in CEO perceptions of stock overvaluation. CEO age may serve as a tractable and theoretically grounded proxy for variations in managerial horizon and career incentives, both of which are likely to influence how managers interpret and respond to valuation signals (Gao, 2010). Differences in career concerns or risk preferences because of age may cause CEOs to respond differently to identical market signals. Younger CEOs, who frequently prioritize career and reputation development (Li et al., 2017; Yim, 2019; Yim, 2013), may be more inclined to pursue growth-oriented investments to align with investor sentiment. In contrast, older CEOs may adopt a more cautious approach to safeguard their reputation and mitigate downside risk. These age-based differences may cause CEOs to respond differently to stock overvaluation when making R&D investment decisions. Despite the relevance of CEO age in influencing R&D responses to stock overvaluation, this topic remains largely unexplored.
Previous studies suggest that younger CEOs are more active in promoting innovation. For example, Yim and Kang (2024) document that CEO age is negatively associated with innovation activities in Korean firms, and Zou et al. (2024) report similar evidence for Chinese firms. However, it remains unclear whether this pattern reflects an intrinsic managerial focus on innovation or stems from a stronger response to market signals such as stock overvaluation. That is, what appears to be innovation-friendly behavior among younger CEOs may partly reflect their stronger responsiveness to stock market signals rather than intrinsic managerial preferences for innovation. This distinction is important because stock overvaluation can change the financing and market-expectation environment surrounding R&D investment. It may encourage R&D investment by easing equity financing or by increasing pressure to meet investor expectations. At the same time, it may discourage R&D investment if managers view high valuations as temporary and difficult to sustain. Thus, this study examines whether younger CEOs respond differently to stock overvaluation when making R&D investment decisions.
This study examines the impact of CEO age using a sample of Korean listed firms as an empirical context. Korea provides an ideal research context for three reasons. First, its economy is predominantly driven by innovation, with R&D being crucial for both firm strategy and national competitiveness. Korea consistently ranks among the top countries in R&D intensity, with firms investing heavily in innovation (The Organisation for Economic Co-operation and Development, 2023). However, the conversion of R&D inputs into innovative results remains relatively low (Choi et al., 2024). This persistent input-output gap raises the question of whether certain R&D spending is influenced by market signals rather than intrinsic innovation strategies. Second, the Korean stock market exhibits relatively high valuation volatility, with prices that tend to deviate from fundamentals, thereby exposing managers to distorted market signals (Kim et al., 2025). Such an environment enables a closer examination of managers’ responses to valuation distortions, especially regarding long-term investment decisions such as R&D. Third, CEO career dynamics in Korea are uniquely influenced by short tenures and performance-sensitive turnover (Park and Yoo, 2016). These conditions may amplify younger CEOs’ career concerns, making them more likely to respond to stock overvaluation with visible, growth-oriented investments such as R&D. Collectively, these characteristics make Korea a suitable context for investigating how CEO traits influence the responses to stock overvaluation, this topic remains largely unexplored.
Utilizing panel data from Korean listed firms from 2012 to 2022, this study demonstrates a more pronounced positive association between stock overvaluation and R&D investment in firms led by younger CEOs. Preliminary univariate tests indicate that overvalued firms invest more in R&D than undervalued firms, with the difference being more pronounced for firms led by younger CEOs. Consistent with this trend, the baseline regression results indicate that the positive correlation between stock overvaluation and R&D investment is significantly stronger in firms led by younger CEOs. Importantly, when stock overvaluation is explicitly considered, the standalone effect of younger CEOs on R&D investment becomes statistically insignificant, implying that younger CEOs’ higher innovation investment may be largely due to their stronger responsiveness to stock misvaluation.
To address potential endogeneity concerns, this study employs a system generalized method of moments (GMM) estimation and propensity score matching (PSM). The GMM analysis accounts for the dynamic nature of R&D investment and potential reverse causality between stock valuation and investment decisions. The results indicate a positive and significant relationship between stock overvaluation and CEO age. The PSM approach further mitigates potential selection bias by matching firms led by younger CEOs with those led by older CEOs, as well as matching overvalued firms with their non-overvalued counterparts. The R&D response among younger CEOs remains consistent across the matched samples, implying that the findings reflect systematic differences in how CEOs interpret and respond to stock overvaluation. In addition, the results are robust to various specifications, including CEO fixed effects, industry-by-year fixed effects, industry-adjusted R&D intensity, and a continuous measure of stock misvaluation.
To examine the underlying mechanism, this study distinguishes between the equity financing and catering explanations. The results do not strongly support the equity financing channel as the primary explanation. Although firms led by younger CEOs are more inclined to issue equity when their stocks are overvalued, equity issuance does not predict future R&D investment, and the interaction between overvaluation and financial constraints is statistically insignificant. Rather, the evidence aligns more with a catering-based interpretation. The R&D response among younger CEOs is particularly pronounced when the shareholder base is dominated by short-horizon investors, implying that younger CEOs may increase R&D investment in response to market expectations embedded in stock prices.
This study contributes to the literature in three main ways. First, this study adds to the literature on stock misvaluation and corporate investment by demonstrating that the impact of stock overvaluation on R&D investment depends on CEO characteristics. Prior studies demonstrate that stock overvaluation can influence corporate investment and innovation decisions but typically assume that managers respond uniformly to valuation signals (Dong et al., 2021; Li, 2026; Luo et al., 2022; Shen et al., 2021). Using CEO age as a proxy for interpretive heterogeneity, this study demonstrates that the positive association between stock overvaluation and R&D investment is significantly stronger in firms led by younger CEOs. These findings imply that the real effects of stock misvaluation depend not only on valuation signals but also on how managers interpret them.
Second, by associating CEO characteristics with valuation-driven investment behavior, this study bridges the managerial attributes literature with the behavioral corporate finance literature on stock misvaluation. Prior studies indicate that younger CEOs are associated with higher levels of innovation (Barker and Mueller, 2002; Bostan and Mian, 2019; Yim and Kang, 2024; Zou et al., 2024). However, these studies focus on cross-sectional differences in innovation levels and do not examine how CEOs adjust their innovation decisions as market conditions change. By examining how CEO age moderates the relationship between stock overvaluation and R&D investment, this study identifies a dynamic mechanism by which managerial attributes influence firms’ responses to market valuation signals.
Lastly, this study contributes to the valuation-driven investment literature by presenting evidence from an emerging-market context. Most existing studies on stock misvaluation and corporate investment focus on developed economies, particularly the United States. This study examines Korean listed firms and provides evidence from a market characterized by high R&D intensity, greater valuation volatility, and relatively short CEO tenures (Park and Yoo, 2016; Yim, 2019; Yim and Kang, 2024). These institutional features provide an appropriate context for examining how managerial characteristics influence responses to stock overvaluation. Additionally, the mechanism examined in this study is not unique to Korea, as similar valuation-driven incentives may exist in other capital markets where managers are under pressure to respond to market expectations.
This study is organized as follows. Section 2 reviews the related literature and develops the hypotheses. Section 3 describes the data, variable definitions, and empirical model. Section 4 presents the main findings. Finally, Section 5 concludes with a discussion of the implications and limitations.
Ⅱ. Literature Review and Hypothesis Development
2.1 Stock Overvaluation and Corporate Investment
This study pertains to two primary research areas. First, it is rooted in the same motivations that underlie studies examining the relationship between stock overvaluation and corporate investment decisions. The Q theory of investment states that firms increase investment when Tobin’s Q is high, assuming that market valuations accurately reflect future growth opportunities (Tobin, 1969). Although managers frequently have superior internal information, they may also incorporate market signals to complement their private assessments when making investment decisions. This tendency becomes stronger when external signals are deemed informative (Bond et al., 2012; Kau et al., 2008; Lee et al., 2023).
Behavioral finance research challenges the notion that Tobin’s Q reliably captures fundamentals. A growing body of research has shown that asset prices are influenced not only by fundamentals but also by sentiment, cognitive biases, and interpretive noise (Blanchard et al., 1993; Boulton et al., 2020; Campello and Graham, 2013). These distortions may cause stock prices to deviate from their fundamental values, leading to periods of misvaluation. Consequently, investment decisions may deviate from their optimal levels, particularly when Tobin’s Q reflects mispricing rather than genuine investment opportunities (Dong et al., 2012; Polk and Sapienza, 2009). Empirical studies show that stock overvaluation frequently leads to excessive investment. For example, Gilchrist et al. (2005), Mrad et al. (2024), and Polk and Sapienza (2009) demonstrate that firms increase capital expenditures during periods of overvaluation, often choosing to expand despite weak fundamentals. These findings imply that managers may respond to inflated market valuations, even when such valuations are unsupported by underlying performance.
Recent research has broadened this line of inquiry to include R&D investment. R&D is a forward-looking activity with uncertain outcomes and high information asymmetry, making it difficult to assess in real time (Aboody and Lev, 2000; Hall, 2002; Hottenrott et al., 2016). As a result, R&D is especially sensitive to managerial interpretation and external influence. Managers may interpret high stock prices as reflecting strong market expectations, even in the absence of changes in internal fundamentals. For example, Dong et al. (2021) and Shen et al. (2021) discover that overvalued firms allocate more resources to R&D, interpreting investor sentiment as a demand for innovation. Similarly, Li (2026) demonstrates that market optimism correlates with increased R&D investment and enhanced innovation outcomes. According to these findings, stock overvaluation can affect both tangible capital investment and intangible, innovation-driven initiatives.
2.2 CEO age and R&D Investment
Second, this study builds on a significant stream of analysis on CEO characteristics and their impact on innovation-related decisions. Existing research presents two competing perspectives on how CEO age influences innovation behavior. One view suggests that younger CEOs are more likely to take bold or unconventional actions to demonstrate their competence to the labor market (Prendergast and Stole, 1996). Because their career horizon is longer, these CEOs may perceive risky investments, such as mergers and acquisitions (M&A) or R&D, as opportunities to develop their reputation early on (Gao, 2010; Li et al., 2017; Yim, 2013; Yim and Kang, 2024; Zou et al., 2024). This signaling motive may increase their responsiveness to market sentiment and encourage them to meet investor expectations when the firm is overvalued.
Conversely, younger CEOs may be more cautious because their future compensation and career prospects are more sensitive to early performance outcomes (Holmström, 1999). Thus, they may avoid uncertain investments that could jeopardize short-term results, instead prioritizing performance stability to mitigate the risk of early dismissal or reputational damage (Bliss and Rosen, 2001). With limited reputational capital, they encounter greater penalties for failure and are thus less willing to engage in uncertain or unconventional investments (Hirshleifer and Thakor, 1992; Scharfstein and Stein, 1990). Rather than pursuing innovative projects that may be difficult to assess externally, they may prefer safer investments that are easier to justify (Zwiebel, 1995).
These behavioral differences align with the upper echelons theory, which postulates that top executives’ attributes, such as age, experience, and mindset, influence how they make strategic decisions and interpret external signals (Hambrick and Mason, 1984). As older CEOs approach retirement, they are more likely to exhibit risk-averse behavior and shorter planning horizons, making them less willing to take on long-term projects such as R&D. In contrast, younger CEOs may perceive innovation as career-enhancing, especially in contexts where investor expectations are heightened (Barker and Mueller, 2002).
Lifespan developmental psychology provides a complementary explanation for age-related differences in innovation behavior. According to research in this tradition, future time perspective and motivational priorities shift with age: younger individuals emphasize exploration and growth, whereas older individuals increasingly value stability and loss avoidance (Baltes, 1987). Socioemotional selectivity theory supports this view by demonstrating that younger adults prioritize information seeking and long-term rewards, whereas older adults focus on maintaining current performance and limiting downside exposure (Carstensen, 1995). In managerial contexts, these patterns imply that younger CEOs, who have broader future horizons and stronger growth-oriented motivations, may regard rising stock prices as an incentive to undertake ambitious activities such as R&D. Older CEOs, whose goals tend to emphasize stability and risk containment, may instead respond to the same signals more conservatively (Kooij et al., 2011).
These contrasting incentives imply that CEOs may interpret stock price signals in systematically distinct ways depending on their traits (Gao, 2010). When stock prices deviate from firm fundamentals, some CEOs may view this as a transient mispricing, whereas others may perceive it as important information about investor expectations. This variation partly stems from differences in managerial horizon and behavioral disposition, which are frequently associated with observable characteristics such as age (Bantel and Jackson, 1989). Thus, CEO age provides a tractable and interpretable proxy for examining how managerial traits influence firm responses to stock overvaluation. Because R&D project outcomes are uncertain and difficult to assess in the short term, CEOs must rely more heavily on subjective interpretation, which creates greater scope for heterogeneity in how market signals are integrated into R&D decisions.
2.3 Differences from Prior Research
Recent studies have examined the relationship between CEO age and corporate innovation, typically focusing on age as a predictor of firms' innovation outcomes. For example, Yim and Kang (2024) show that younger CEOs in Korean IT firms exhibit higher innovation productivity and a broader technological scope, demonstrating a static association in which CEO age directly influences innovation levels. Although such research advances our understanding of demographic patterns in innovation, it does not address how CEOs of various ages adjust their innovation decisions amidst shifting market conditions.
In contrast, this study examines a dynamic mechanism in which CEO age moderates the responsiveness of R&D investment to stock overvaluation. This approach fundamentally departs from the traditional risk-preference perspective, which interprets age as reflecting inherent risk-taking tendencies and thus predicts differences in baseline innovation levels rather than in responses to valuation shocks. This study instead relies on a market-accommodating interpretation, in which valuation deviations signal investor expectations and managers adjust real decisions accordingly. According to this framework, CEO age influences how strongly managers interpret and react to such valuation signals, rather than acting as a direct driver of innovation intensity. This distinction positions our study within the broader literature on misvaluation-driven investment behavior and highlights interpretive heterogeneity as the primary channel that distinguishes our dynamic approach from static age-innovation analyses.
2.4 Hypothesis Development
Stock overvaluation can influence how CEOs evaluate R&D investment. The key question is not whether younger CEOs unconditionally prefer R&D investment. R&D is a long-horizon investment with uncertain outcomes, significant information asymmetry, and limited short-term verifiability (Aboody and Lev, 2000; Hall, 2002; Hottenrott et al., 2016). These features may render R&D sensitive to managerial interpretations and external market signals (Lee et al., 2023).
The baseline relation between younger CEOs and R&D investment is theoretically ambiguous. Younger CEOs may value R&D because it promotes long-term growth and demonstrates their willingness to pursue innovation. Their longer managerial horizons may make long-horizon projects more attractive. Prior studies also suggest that younger CEOs are more likely to take risks and engage in innovative activities (Li et al., 2017; Prendergast and Stole, 1996; Yim and Kang, 2024; Yim, 2013; Zou et al., 2024). This viewpoint is consistent with lifespan developmental research, which indicates that younger individuals prioritize exploration and long-term rewards (Baltes, 1987; Carstensen, 1995; Kooij et al., 2011). Simultaneously, younger CEOs may avoid R&D because it is costly, uncertain, and difficult to justify in the short term. Early performance outcomes may influence their future compensation and career prospects. Limited reputational capital can also increase the perceived cost of failed investment decisions (Bliss and Rosen, 2001; Hirshleifer and Thakor, 1992; Holmström, 1999; Scharfstein and Stein, 1990; Zwiebel, 1995). Thus, in the absence of valuation pressure, younger CEOs do not necessarily invest more or less in R&D.
Stock overvaluation may render R&D investment more appealing to younger CEOs.
One possible channel is equity financing. Overvaluation reduces the relative cost of issuing equity and enables firms to raise external capital on favorable terms (Baker et al., 2003; Dong et al., 2012; Kim, 2021; Stein, 1996). This financing advantage is significant for R&D, which is difficult to collateralize and frequently encounters external financing frictions. When younger CEOs’ firms are overvalued, they may find it easier to finance long-horizon R&D projects that funding frictions would otherwise limit.
Catering is another possible channel. Overvalued stock prices may reflect heightened investor expectations for future growth. R&D provides a visible way for managers to respond to such expectations by demonstrating their commitment to future technological development. Prior studies demonstrate that overvalued firms tend to increase R&D investment, implying that managers may interpret investor optimism as a demand for innovation (Dong et al., 2021; Shen et al., 2021; Li, 2026). Younger CEOs may be especially responsive to this signal because their longer managerial horizons render visible growth-oriented investment more appealing (Gao, 2010). According to this viewpoint, stock overvaluation enhances the incentive for younger CEOs to expand R&D investment because R&D helps firms align their actions with market expectations.
Although the underlying logic of these channels differs, both imply that younger CEOs may increase R&D investment more aggressively when their firms are overvalued. This reasoning yields the following hypothesis.
Hypothesis 1: Younger CEOs are more likely to increase R&D investment in response to stock overvaluation.
The opposite prediction is also plausible. The same factors that render R&D appealing when overvalued can also make it risky (Luo et al., 2022). If managers believe that high valuations are only temporary, they may become more cautious because overvaluation creates unrealistic expectations (Jensen, 2005). The same characteristics that make R&D sensitive to market signals also make it difficult to defend against overvaluation because R&D outcomes are opaque and delayed (Aboody and Lev, 2000; Hall, 2002). If market sentiment later reverses, delayed and hard-to-verify R&D outcomes may expose managers to criticism for expanding uncertain, long-horizon investments.
This risk-aversion logic may be stronger among younger CEOs. Younger CEOs may have longer managerial horizons, but they may also lack established reputational capital. Their future compensation and career prospects may be more dependent on early performance outcomes (Bliss and Rosen, 2001; Holmström, 1999). In addition, managers with limited reputational capital may avoid projects that are difficult to justify and have uncertain outcomes, as failed projects can be interpreted as poor judgment (Hirshleifer and Thakor, 1992; Zwiebel, 1995). According to this view, overvaluation does not make R&D more appealing to younger CEOs. Instead, it heightens the downside risk of expanding into uncertain, long-horizon investments. Younger CEOs may thus respond to stock overvaluation by reducing R&D investment or demonstrating a weaker R&D response.
Hypothesis 2: Younger CEOs are more likely to exhibit a weaker or negative R&D response to stock overvaluation.
III. Sample and Research Design
3.1 Sample
The sample comprises non-financial firms listed on the Korea Exchange (KRX) between 2012 and 2022. Financial and insurance firms (two-digit Korean Standard Industrial Classification (KSIC) codes 64-66) and utility firms (two-digit KSIC codes 35-39) are excluded because their accounting structures and regulatory environments vary from those of other listed firms.
The study begins by creating a panel dataset to estimate stock overvaluation. The initial sample includes all firms listed on the KRX from 2012 to 2022, with fiscal years ending in December, and uses Data Guide 5.0 to estimate stock overvaluation. Observations are excluded if they lack the market value of equity or have a book value of equity of zero or negative. This filtering yields an unbalanced panel of 22,289 firm-year observations. To guarantee reliable estimation, any industry-year (based on two-digit KSIC codes) with fewer than ten firms is excluded (e.g., Kim, 2021; Kim, 2024). Subsequently, 21,142 firm-year observations remain for estimating stock overvaluation.
The panel dataset generated for estimating stock overvaluation is then compared to the firm-level data used in the empirical analysis, which includes CEO age, R&D expenditures, and other control variables. CEO age data are gathered from TS-2000, while R&D expenditure and firm-level control variable data are obtained from Data Guide 5.0. After merging these datasets, the empirical analysis’s final sample comprises 17,551 firm-year observations.
3.2 Variables
3.2.1 R&D investment
This study utilizes R&D intensity (RDI) as a proxy for R&D investment. Specifically, RDI is computed as total R&D expenditures divided by total sales, with total R&D expenditures defined as the sum of R&D costs expensed on the income statement and those capitalized as intangible assets.
3.2.2 Younger CEO
This study defines a firm’s CEO as the executive who signs the annual report submitted to the Financial Supervisory Service, as per Yim and Kang (2024). When a firm adopts a co-CEO structure, I follow the established practice in the Korean literature (e.g., Yim, 2019) and identify the CEO as the individual who appears first among the CEOs who sign the annual report.
The CEO’s age is calculated as the fiscal year minus their birth year plus one. To classify CEOs by age, this study adopts a fixed age-based cutoff. Specifically, CEOs under 60 are classified as younger CEOs, whereas those aged 60 or older are classified as older CEOs (Yim, 2019). The age threshold of 60 reflects the typical retirement age and executive career patterns in Korean listed firms, and it provides a transparent and consistent criterion for distinguishing between different stages of executive careers (Yim and Kang, 2024). Accordingly, the indicator variable YoungerCEO equals 1 if the CEO is younger than 60 in a given year, and 0 otherwise.1
3.2.3 Stock Overvaluation
To measure stock overvaluation, this study follows the decomposition method of Rhodes-Kropf et al. (2005), as adopted in recent literature (e.g., Alzahrani and Rao, 2014; Bonaimé et al., 2014; Jin, 2022; Kim, 2021; Mrad et al., 2024). The approach decomposes the natural logarithm of the M/B ratio into three components: firm-specific misvaluation (FSE), time-series misvaluation (TSE), and long-term value to book (LVTB). This decomposition is described as follows:
where j indicates the industry while mit and bit denote the natural logarithm of the market value and book value of equity, respectively. The term v(θit; α) represents the predicted value as a function of firm-specific accounting information, θit, and accounting multiples, α. The first component of Eq. (1), mit - v(θit; αjt), captures the deviation between a firm’s market value and its predicted fundamental value, conditional on the industry j multiples at year t. The second component, v(θit; αjt) - v(θit; αj), reflects valuation effects specific to industry j. The final component, v(θit; αj) - bit, captures firms’ long-term growth opportunities (Jin, 2022; Kim, 2021; Kim, 2024; Mrad et al., 2024).
To implement Rhodes-Kropf et al.’s (2005) valuation approach, this study estimates a cross-sectional regression model in which the natural logarithm of the market value of equity (m) is expressed as a linear function of book value of equity (b), net income (NI), and market leverage (LEV_RK). These accounting variables are mapped onto market equity using industry-year-specific accounting multiples (α). In accordance with this study’s purpose, the focus is on estimating mit - v(θit; αjt) to represent FSE. Because the decomposition explicitly separates LVTB and TSE, the FSE component primarily captures firm-specific deviations of market value from fundamentals. This component is computed as the residual from the following regression model:
where ln NIit+ denotes the natural logarithm of the absolute value of net income and Loss is an indicator variable that equals one if net income is negative. Following Bonaimé et al. (2014), market leverage (LEV_RK) is defined as:
This market-based leverage measure ensures consistency with the valuation framework by mapping accounting fundamentals to market equity values.
The regression model is estimated annually for each industry (based on two-digit KSIC codes) during the sample period (Kim, 2021). Table A2 provides summary statistics and estimation results. This study develops a measure of stock misvaluation for each firm-year observation using the FSE from Eq. (2). Following prior studies (e.g., Bonaimé et al., 2014), the FSE values are divided into annual terciles to classify firms by valuation status. Firms in the top tercile are classified as overvalued, meaning their market values deviate positively from fundamentals. Firms in the bottom tercile are considered undervalued, whereas those in the middle tercile are deemed fairly valued. The indicator variable Overvalued equals 1 if a firm belongs to the top tercile of the annual FSE distribution, and 0 otherwise.
Table 1 presents the distribution of sample firm-year observations by stock misvaluation status and CEO age group over the sampling period. The number of observations in each category remains relatively stable over time, indicating that the sample is fairly balanced across valuation states and CEO age groups.
Table 1 Yearly distribution of sample firms
| Year | CEO age group | Stock valuation status | Total | |||
|---|---|---|---|---|---|---|
| Firms with younger CEOs | Firms with older CEOs | Overvalued | Fairly valued | Undervalued | ||
| 2012 | 1,001 | 351 | 450 | 451 | 451 | 1,352 |
| 2013 | 971 | 390 | 453 | 454 | 454 | 1,361 |
| 2014 | 970 | 425 | 465 | 465 | 465 | 1,395 |
| 2015 | 984 | 432 | 472 | 472 | 472 | 1,416 |
| 2016 | 1,040 | 469 | 503 | 503 | 503 | 1,509 |
| 2017 | 1,103 | 502 | 535 | 535 | 535 | 1,605 |
| 2018 | 1,138 | 528 | 555 | 555 | 556 | 1,666 |
| 2019 | 1,155 | 578 | 577 | 578 | 578 | 1,733 |
| 2020 | 1,194 | 604 | 599 | 599 | 600 | 1,798 |
| 2021 | 1,168 | 660 | 609 | 609 | 610 | 1,828 |
| 2022 | 1,183 | 705 | 629 | 629 | 630 | 1,888 |
| Total | 11,907 | 5,644 | 5,847 | 5,850 | 5,854 | 17,551 |
This table presents the number of sample firms for each year from 2012 to 2022, categorized by CEO age group (younger and older CEOs) and by stock valuation status (overvalued, fairly valued, and undervalued). CEO age groups are defined by a cutoff of 60 years: CEOs younger than 60 are classified as younger CEOs, and those aged 60 or older are classified as older CEOs. The stock misvaluation status is determined based on the annual terciles of firm-specific misvaluation values.
3.2.4 Control Variables
This study includes a set of control variables commonly used in R&D investment research. Specifically, I control for firm size (FirmSIZE), as larger firms typically have greater resources to support innovation activities; firm age (FirmAGE), which captures organizational maturity that may influence innovation investment; asset tangibility (TANG), as firms with more tangible assets may encounter varying financing constraints for R&D; leverage (LEV), which reflects financial risk and may limit discretionary investment; return on assets (ROA), a proxy for firm profitability and internal funding capacity; and annual sales growth (GROWTH), which captures firms’ growth opportunities. Additionally, I control for foreign ownership (FOR) and large shareholdings (LARGE), as ownership structure may influence managerial monitoring and investment decisions. Finally, stock beta (BETA) is incorporated to account for firm-level systematic risk that may influence corporate investment behavior. Table A1 summarizes the definitions for all variables.
3.3 Descriptive Statistics
Table 2 presents the summary statistics. To reduce the influence of outliers, I winsorize all continuous variables at the 1st and 99th percentiles. The mean value of R&D intensity (RDI) is 0.0272, indicating that, on average, firms allocate approximately 2.72% of their total sales to R&D investment. The mean value of the stock misvaluation measure is close to zero (-0.0062). The average CEO age is 55.89 years, while the proportion of firms classified as having younger CEOs is 67.84%.
Table 2 Summary statistics
| Variable | Mean | SD | p01 | p25 | p50 | p75 | p99 |
|---|---|---|---|---|---|---|---|
| RDI | 0.0272 | 0.0533 | 0.0000 | 0.0000 | 0.0052 | 0.0298 | 0.3252 |
| CEO age | 55.8879 | 7.7753 | 38.0000 | 51.0000 | 56.0000 | 61.0000 | 75.0000 |
| YoungerCEO | 0.6784 | 0.4671 | 0.0000 | 0.0000 | 1.0000 | 1.0000 | 1.0000 |
| Stock misvaluation | -0.0062 | 0.6030 | -1.3711 | -0.4165 | -0.0412 | 0.3716 | 1.6576 |
| Overvalued | 0.3331 | 0.4714 | 0.0000 | 0.0000 | 0.0000 | 1.0000 | 1.0000 |
| FirmSIZE | 19.1561 | 1.4576 | 16.6729 | 18.1548 | 18.8681 | 19.8783 | 24.1206 |
| FirmAGE | 3.1849 | 0.7001 | 0.6931 | 2.8332 | 3.2189 | 3.7377 | 4.3307 |
| TANG | 0.2978 | 0.1855 | 0.0035 | 0.1494 | 0.2885 | 0.4283 | 0.7482 |
| LEV | 0.4250 | 0.2031 | 0.0548 | 0.2553 | 0.4185 | 0.5757 | 0.8881 |
| ROA | 0.0300 | 0.0779 | -0.2561 | 0.0028 | 0.0337 | 0.0700 | 0.2250 |
| GROWTH | 0.1322 | 0.2179 | -0.2043 | 0.0104 | 0.0814 | 0.1847 | 1.1170 |
| FOR | 0.0635 | 0.0994 | 0.0000 | 0.0071 | 0.0219 | 0.0710 | 0.5164 |
| LARGE | 0.3960 | 0.1686 | 0.0634 | 0.2677 | 0.3899 | 0.5116 | 0.7863 |
| BETA | 0.8527 | 0.4037 | -0.0170 | 0.5693 | 0.8559 | 1.1342 | 1.8148 |
This table shows the mean, standard deviation (SD), and selected percentiles (1st, 25th, 50th, 75th, and 99th) for the variables. All continuous variables are winsorized at the 1st and 99th percentiles. Table A1 provides the variable definitions.
Regarding firm characteristics, the mean values of firm size (FirmSIZE) and firm age (FirmAGE) are 19.15 and 3.18, respectively. For the other variables, the average tangibility (TANG) is 29.78%, and the average debt ratio (LEV) is 42.50% of total assets. Furthermore, a sample firm has, on average, a return on assets (ROA) of 3.00% and an annual sales growth rate (GROWTH) of 13.22%. Additionally, foreign ownership (FOR) averages 6.35%, and the ownership share held by the largest shareholder and affiliated parties (LARGE) is 39.60%, indicating a relatively high level of ownership concentration among sample firms. The mean value of BETA is 0.8527.
Table 3 presents the Pearson correlation coefficients among the variables. The dependent variable, RDI, positively correlates with YoungerCEO, implying that firms led by younger CEOs tend to exhibit higher R&D intensity. Overvalued scores positively correlate with RDI, consistent with the perspective that higher valuations correlate with greater R&D investment. RDI positively correlates with FirmSIZE, TANG, ROA, GROWTH, FOR, and BETA, whereas it negatively correlates with FirmAGE, LEV, and LARGE. Among the control variables, none of the correlations exceeds 0.5, and the variance inflation factors (VIFs), although not tabulated, are all below 10. These results indicate that multicollinearity is unlikely to be a concern in the regression analyses.
Table 3 Correlation coefficient matrix
| (1) | (2) | (3) | (4) | (5) | (6) | |
|---|---|---|---|---|---|---|
| (1) RDI | 1 | |||||
| (2) YoungerCEO | 0.1058** | 1 | ||||
| (3) Overvalued | 0.1271** | 0.0356** | 1 | |||
| (4) FirmSIZE | 0.0903** | -0.2462** | 0.0299** | 1 | ||
| (5) FirmAGE | -0.1601** | -0.1834** | -0.1003** | 0.2766** | 1 | |
| (6) TANG | 0.1283** | -0.1866** | -0.0551** | 0.1673** | 0.1154** | 1 |
| (7) LEV | -0.1400** | -0.0808** | 0.0145** | 0.2683** | 0.0750** | 0.2436** |
| (8) ROA | 0.0891** | -0.1094** | 0.0557** | 0.1908** | -0.0664** | 0.0001** |
| (9) GROWTH | 0.0808** | 0.0979** | 0.1234** | -0.0141** | -0.3109** | -0.0820** |
| (10) FOR | 0.0400** | -0.1058** | 0.1183** | 0.3663** | 0.0830** | -0.0167** |
| (11) LARGE | -0.1954** | -0.1324** | -0.0767** | 0.1918** | 0.1048** | 0.1276** |
| (12) BETA | 0.1387** | 0.0103** | 0.1562** | 0.0306** | -0.0293** | -0.0488** |
| (7) | (8) | (9) | (10) | (11) | (12) | |
| (7) LEV | 1 | |||||
| (8) ROA | -0.2253** | 1 | ||||
| (9) GROWTH | -0.0015** | 0.1943** | 1 | |||
| (10) FOR | -0.0708** | 0.2137** | 0.0145** | 1 | ||
| (11) LARGE | -0.0860** | 0.1872** | -0.0454** | -0.0362** | 1 | |
| (12) BETA | 0.0082** | -0.0224** | 0.1066** | -0.0118** | -0.1712** | 1 |
This table presents the Pearson correlation coefficients for the main variables in the analysis. All continuous variables are winsorized at the 1st and 99th percentiles. Table A1 provides the variable definitions. ** indicates statistical significance at the 5% level.
Ⅳ. Empirical Results
4.1 Univariate Results
Table 4 reports univariate comparisons of subsequent R&D intensity (RDI) across CEO age groups (younger CEOs vs. older CEOs) and stock misvaluation status (overvalued vs. undervalued firms). Panel A presents the mean RDI values. Firms led by younger CEOs exhibit a higher average RDI (3.09%) than those led by older CEOs (1.95%), with a difference of 1.14 percentage points that is statistically significant. Similarly, overvalued firms exhibit an average RDI of 3.68%, whereas undervalued firms demonstrate a significantly lower average of 2.05%, thus yielding a difference of 1.63 percentage points.
Table 4 Univariate and pairwise comparisons of average/median R&D intensity
| Panel A. Univariate comparisons of average R&D intensity | |||
|---|---|---|---|
| N | Average RDI (%) | Difference (p-value) | |
| Younger CEO | 11,907 | 3.0922 | 1.1441*** (0.003) |
| Older CEO | 5,644 | 1.9481 | |
| Overvalued | 5,847 | 3.6821 | 1.6346*** (0.001) |
| Undervalued | 5,854 | 2.0475 | |
| Panel B. Univariate comparisons of median R&D intensity | |||
| N | Median RDI (%) | Difference (p-value) | |
| Younger CEO | 11,907 | 0.6018 | 0.2143** (0.039) |
| Older CEO | 5,644 | 0.3874 | |
| Overvalued | 5,847 | 0.8480 | 0.5655*** (0.008) |
| Undervalued | 5,854 | 0.2826 | |
| Panel C. Univariate pairwise comparisons of average R&D intensity (%) | |||
| Overvalued | Undervalued | Difference (p-value) | |
| Younger CEO | 4.1372 (N = 4,136) | 2.1040 (N = 3,835) | 2.0332*** (0.000) |
| Older CEO | 2.3997 (N = 1,711) | 1.6604 (N = 2,019) | 0.6993** (0.023) |
| Difference (p-value) | 1.7375*** (0.001) | 0.4026* (0.082) | |
| Panel D. Univariate pairwise comparisons of median R&D intensity (%) | |||
| Overvalued | Undervalued | Difference (p-value) | |
| Younger CEO | 0.9829 (N = 4,136) | 0.3241 (N = 3,835) | 0.6687*** (0.001) |
| Older CEO | 0.3772 (N = 1,711) | 0.2658 (N = 2,019) | 0.1114 (0.197) |
| Difference (p-value) | 0.6057*** (0.003) | 0.0484 (0.232) | |
This table presents the univariate and pairwise comparisons of R&D intensity. Panels A and B compare the average and median R&D intensity between firms led by younger and older CEOs, as well as between overvalued and undervalued firms. Panels C and D show the pairwise comparisons of average and median R&D intensity across four subsamples, characterized by the combination of CEO age (younger vs. older) and valuation status (overvalued vs. undervalued). The differences in means (medians) are evaluated using t-tests (Wilcoxon rank-sum tests). ***, **, and * indicate statistical significance at the 1%, 5%, and 10% levels, respectively.
Panel B reports the median comparisons and demonstrates a similar trend. The median RDI is significantly higher for firms with younger CEOs (0.60%) than for those with older CEOs (0.39%). In addition, overvalued firms (0.85%) exhibit higher median RDI than undervalued firms (0.28%).
Panels C and D present pairwise comparisons of both CEO age and stock misvaluation status (i.e., (a) Younger CEO and Overvalued, (b) Older CEO and Overvalued, (c) Younger CEO and Undervalued, and (d) Older CEO and Undervalued). In Panel C, the average RDI is 4.14% for overvalued firms and 2.10% for undervalued firms among firms with younger CEOs, yielding a difference of 2.03 percentage points. For older CEOs, the average RDI is 2.40% for overvalued firms and 1.66% for undervalued firms, with a smaller difference of 0.70 percentage points. Regarding the median values in Panel D, the median RDI is 0.98% for overvalued firms and 0.32% for undervalued firms among firms led by younger CEOs. The difference of 0.68 percentage points is statistically significant at the 1% level. In comparison, firms led by older CEOs exhibit a smaller and statistically insignificant difference, with median RDIs of 0.38% and 0.27% in overvalued and undervalued firms, respectively. Overall, these results indicate that the positive association between stock overvaluation and R&D investment is more pronounced when younger CEOs lead firms.
4.2 Baseline Regressions
To test the hypotheses, this study estimates the following regression model:
where i and t denote firm and year, respectively. The dependent variable is R&D investment, proxied by R&D intensity in the subsequent year. The explanatory variables include a dummy for younger CEOs (YoungerCEO), an indicator for stock overvaluation (Overvalued), and their interaction term (YoungerCEO × Overvalued). X denotes a vector of control variables. Firm and year fixed effects (FIRM and YR) control for unobserved heterogeneity across firms and years. To mitigate potential simultaneity concerns, the explanatory variables are measured in year t, whereas the dependent variable is measured in year t+1. Standard errors are clustered at the firm level.
The main coefficient of interest is $\beta_{YO}$, which captures whether younger CEOs respond differently to stock overvaluation in their R&D investment decisions. A positive (negative) $\beta_{YO}$ indicates that younger CEOs increase (decrease) R&D investment more (less) than their older counterparts when their firms are overvalued. Accordingly, hypothesis 1 predicts $\beta_{YO} > 0$, whereas hypothesis 2 predicts $\beta_{YO} < 0$.
Table 5 reports the baseline regression results. Column (1) presents the baseline specification without control variables, whereas column (2) includes the full set of firm-level controls. Across both specifications, the coefficient on Overvalued is positive and statistically significant, implying that firms increase R&D investment when their stocks are overvalued. More importantly, the interaction term YoungerCEO × Overvalued is positive and statistically significant across specifications. In column (2), the coefficient on the interaction term ($\beta_{YO}$) is 0.6861 (p < 0.01), indicating that the positive association between stock overvaluation and R&D investment is significantly stronger for firms led by younger CEOs.
Table 5 Baseline regression results
| Dependent variable = RDIt+1 | |||
|---|---|---|---|
| (1) | (2) | ||
| YoungerCEO | βY | 0.2775 (1.50) | 0.0803 (0.66) |
| Overvalued | βO | 0.8623*** (4.73) | 0.6227*** (3.46) |
| YoungerCEO × Overvalued | βYO | 0.6579*** (2.72) | 0.6861*** (2.88) |
| FirmSIZE | γ1 | 0.3038*** (4.61) | |
| FirmAGE | γ2 | -0.6241*** (-5.59) | |
| TANG | γ3 | 0.8674* (1.93) | |
| LEV | γ4 | -3.3412*** (-7.81) | |
| ROA | γ5 | 8.5946*** (7.10) | |
| GROWTH | γ6 | 0.5043 (1.45) | |
| FOR | γ7 | 1.0128 (1.08) | |
| LARGE | γ8 | -3.1018*** (-6.86) | |
| BETA | γ9 | 0.5329*** (3.77) | |
| Constant | β0 | -0.4660** (-2.27) | -0.5913 (-0.49) |
| Firm FE | Yes | Yes | |
| Year FE | Yes | Yes | |
| # of firm-years | 17,551 | 17,551 | |
| # of firms | 2,170 | 2,170 | |
| Within R2 | 0.1366 | 0.2136 | |
This table presents the baseline regression results. The dependent variable is RDI (×100). YoungerCEO is a binary variable that equals 1 if the CEO is younger than 60 years and 0 otherwise. Overvalued is a binary variable that equals 1 for firms in the top tercile of the annual distribution of firm-specific misvaluation, and 0 otherwise. Table A1 provides the variable definitions. The t-statistics based on clustered standard errors at the firm level are presented in parentheses. ***, **, and * indicate statistical significance at the 1%, 5%, and 10% levels, respectively.
The economic magnitude of this effect is also substantial. In column (2), the coefficient on Overvalued is 0.6227, implying that firms led by older CEOs increase RDI by approximately 0.62 percentage points when their stocks are overvalued. For firms led by younger CEOs, the response to overvaluation is 0.69 percentage points higher. Collectively, this implies that overvaluation correlates with an increase of approximately 1.31 percentage points in RDI for firms led by younger CEOs. Considering that the sample mean of RDI is approximately 2.7%, this represents a sizeable increase in innovation investment.
The coefficient on YoungerCEO itself is statistically insignificant across specifications. When stock overvaluation is considered, this result indicates that younger CEOs do not systematically invest more in R&D than older CEOs. This finding varies from prior studies that document a stronger propensity for innovation among younger CEOs (e.g., Yim, 2019; Yim and Kang, 2024; Zou et al., 2024). One possible interpretation is that the positive relationship between younger CEOs and innovation observed in previous studies may partly reflect their stronger response to periods of stock overvaluation. Consistent with this interpretation, once stock overvaluation is explicitly considered, the standalone effect of younger CEOs on R&D investment is no longer statistically distinguishable from zero. Instead, the findings indicate that younger CEOs’ higher R&D investment is primarily due to a stronger response to stock overvaluation.
Although the risk-aversion perspective hypothesizes that CEOs may reduce R&D investment when firms are overvalued, our results provide minimal support for this hypothesis. One possible explanation is that younger CEOs often experience stronger career concerns and incentives to demonstrate growth-oriented performance (Li et al., 2017; Yim, 2019; Yim, 2013). In the Korean corporate context, where technological competitiveness and innovation are extensively regarded as key drivers of long-term firm value, managers may encounter strong pressure to pursue visible investment activities such as R&D rather than adopt a conservative investment stance (Yim, 2019). In addition, periods of stock overvaluation can reduce the perceived downside risk associated with investment decisions by acting as a valuation buffer (Polk and Sapienza, 2009; Stein, 1996). Consequently, the risk-aversion viewpoint may be less likely to dominate managerial investment decisions in this context.
4.3 Endogeneity
Endogeneity is a potential source of concern for the baseline regression results, as the observed positive association between stock overvaluation and R&D investment may partly reflect reverse causality. For example, if investors expect a firm to increase its R&D investment, the stock market may factor this expectation into the firm’s stock price, leading to higher valuations (Dong et al., 2021; Li, 2026; Luo et al., 2022). In this case, causality would be from expected R&D investment to stock overvaluation, rather than the other way around.
To account for the possibility of reverse causality, this study estimates a dynamic panel model using the two-step system GMM (Arellano and Bover, 1995; Roodman, 2009).2 This method is well-suited for contexts where the dependent variable, RDI, is potentially endogenous and influenced by its past values. System GMM can help control for unobserved firm-specific effects and endogeneity in explanatory variables, including the interaction term, by incorporating the dependent variable’s lagged values as regressors and employing appropriate internal instruments. This approach enables us to obtain consistent estimates even when Overvalued, alongside its interaction with YoungerCEO, is potentially endogenous.
Table 6 presents the estimation results. The Hansen test for overidentifying restrictions and the Arellano-Bond test for second-order serial correlation (AR(2)) indicate that the model is correctly specified. Consistent with the baseline results, the coefficient for the interaction term YoungerCEO × Overvalued remains positive and statistically significant. This finding confirms that the positive correlation between stock overvaluation and R&D investment is stronger for firms led by younger CEOs.
Table 6 Endogeneity: System GMM
| Dependent variable = $RDI_{t+1}$ (%) | ||
|---|---|---|
| RDI | $\delta$ | 0.4990*** (10.55) |
| YoungerCEO | $\beta_Y$ | 0.0411 (0.20) |
| Overvalued | $\beta_O$ | 0.6125*** (2.97) |
| YoungerCEO × Overvalued | $\beta_{YO}$ | 0.4789** (2.25) |
| FirmSIZE | $\gamma_1$ | 0.1560 (1.40) |
| FirmAGE | $\gamma_2$ | -0.6182*** (-3.90) |
| TANG | $\gamma_3$ | 0.6222 (0.85) |
| LEV | $\gamma_4$ | -2.3300*** (-3.92) |
| ROA | $\gamma_5$ | 2.4897*** (5.32) |
| GROWTH | $\gamma_6$ | 0.8230* (1.76) |
| FOR | $\gamma_7$ | 2.4850* (1.80) |
| LARGE | $\gamma_8$ | -3.1166*** (-4.02) |
| BETA | $\gamma_9$ | 0.7611*** (2.98) |
| Constant | $\beta_0$ | 5.6111*** (4.00) |
| Firm FE | Yes | |
| Year FE | Yes | |
| # of firm years | 17,551 | |
| # of firms | 2,170 | |
| AR (1) test (p-value) | 0.000 | |
| AR (2) test (p-value) | 0.421 | |
| Hansen J test (p-value) | 0.667 |
This table presents the results of the dynamic panel model estimated through system GMM. The dependent variable is RDI (×100). YoungerCEO is a binary variable that equals 1 if the CEO is younger than 60 years and 0 otherwise. Overvalued is a binary variable that equals 1 for firms in the top tercile of the annual distribution of firm-specific misvaluation, and 0 otherwise. Table A1 provides the variable definitions. Windmeijer’s (2005) corrected z-statistics are presented in parentheses. ***, **, and * indicate statistical significance at the 1%, 5%, and 10% levels, respectively.
Another potential concern is that firms led by younger CEOs and those that are overvalued may systematically differ from their counterparts in observable firm characteristics. If these differences are related to CEO age or stock overvaluation and firms’ R&D investment decisions, the baseline regression results may be influenced by selection bias. For instance, prior studies indicate that firms led by younger CEOs frequently differ from those led by older CEOs in several observable characteristics (Yim and Kang, 2024). Similarly, overvalued firms may exhibit distinct characteristics, such as size, profitability, and growth opportunities, which have been shown to influence corporate investment behavior.
To address this concern, this study employs PSM to generate more comparable samples. Separate matching procedures are used to match firms led by older CEOs with firms led by younger CEOs, as well as overvalued firms with non-overvalued firms. Because the number of firms with younger CEOs exceeds that of firms with older CEOs, firms led by older CEOs are regarded as the treatment group to ensure adequate matching quality. The propensity scores are estimated using the entire set of control variables included in the baseline regression model. To pair treated firms with observationally similar control firms, I perform one-to-one nearest-neighbor matching without replacement, applying a common-support restriction.3
Before matching, significant differences in several covariates are observed between the treated and control groups. These differences are detailed in Table A3 of the Appendix. Following matching, covariate imbalances are significantly reduced. Figure 1 shows the standardized percentage bias for each covariate before and after matching. The standardized percentage bias is a commonly used diagnostic measure of covariate balance that indicates how comparable the treated and control groups are for each covariate (Guo and Fraser, 2014; Rosenbaum and Rubin, 1985). As shown in the figure, the standardized biases for all covariates are significantly reduced after matching and are nearly zero, implying that the matching procedure enhances covariate balance between the treated and control groups.4
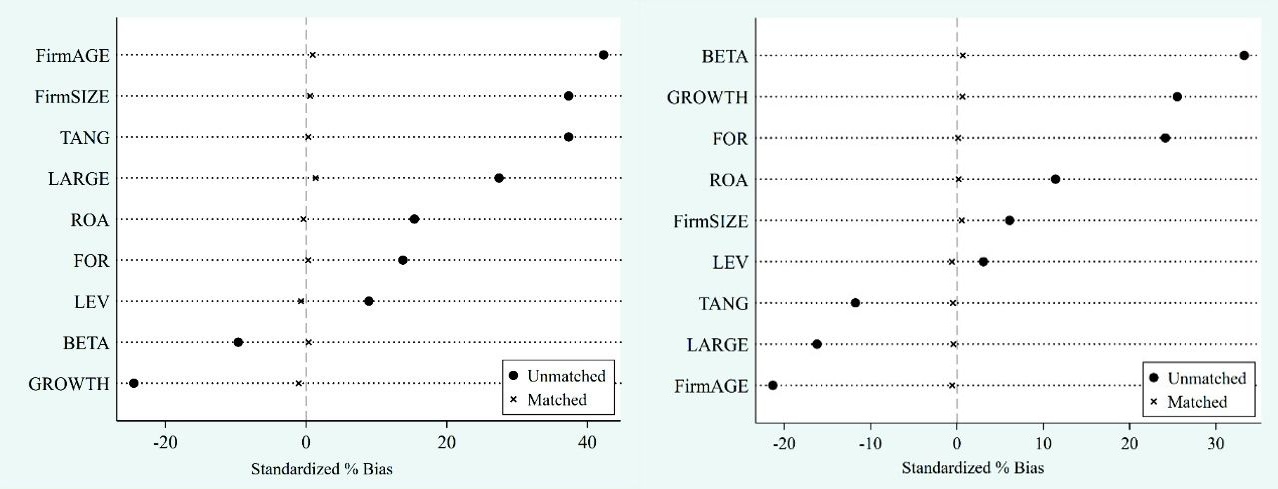
This figure shows the standardized percentage bias for each covariate before and after one-to-one nearest-neighbor matching. Panel A shows the results for firms with younger versus older CEOs, while Panel B shows the results for overvalued versus non-overvalued firms.
This study uses the matched samples to re-estimate the baseline regression model. Table 7 shows the results. Column (1) presents the findings from a matched sample based on CEO age, whereas column (2) displays the results from a matched sample based on stock overvaluation. The coefficient on the interaction term YoungerCEO × Overvalued remains positive and statistically significant across both matched samples. This result indicates that heightened R&D response to stock overvaluation among younger CEOs persists after firms are matched on observable characteristics. Overall, the PSM results provide complementary evidence that the baseline findings are unlikely to be driven solely by observable disparities between firms led by younger and older CEOs, or between overvalued and non-overvalued firms.
Table 7 Propensity score matching
| Dependent variable = RDIt+1 (%) | |||
|---|---|---|---|
| (1) Younger CEO-matched sample | (2) Overvalued-matched sample | ||
| YoungerCEO | $\beta_Y$ | 0.0299 (0.26) | −0.0285 (−0.17) |
| Overvalued | $\beta_O$ | 0.5829*** (3.23) | 0.6614*** (3.39) |
| YoungerCEO × Overvalued | $\beta_{YO}$ | 0.5281** (2.08) | 0.7128*** (2.76) |
| FirmSIZE | $\gamma_1$ | 0.2513*** (4.27) | 0.3464*** (4.69) |
| FirmAGE | $\gamma_2$ | −0.5227*** (−4.63) | −0.6978*** (−5.25) |
| TANG | $\gamma_3$ | 0.5902 (1.53) | 1.1166** (2.06) |
| LEV | $\gamma_4$ | −2.4066*** (−6.06) | −4.2147*** (−8.48) |
| ROA | $\gamma_5$ | 5.4336*** (4.12) | 9.7666*** (6.73) |
| GROWTH | $\gamma_6$ | 0.1875 (0.70) | 0.3100 (0.84) |
| FOR | $\gamma_7$ | 1.0308 (1.13) | 1.4012 (1.38) |
| LARGE | $\gamma_8$ | −3.1457*** (−7.03) | −3.4171*** (−6.20) |
| BETA | $\gamma_9$ | 0.1954 (1.43) | 0.5044*** (3.02) |
| Constant | $\beta_0$ | −0.4874 (−0.42) | −0.7283 (−0.53) |
| Firm FE | Yes | Yes | |
| Year FE | Yes | Yes | |
| # of firm years | 11,278 | 11,688 | |
| # of firms | 1,901 | 2,123 | |
| Within $R2$ | 0.1871 | 0.1875 | |
This table reports the results for the propensity score-matched samples. Column (1) presents the results based on a matched sample of firms with younger CEOs and their counterparts, while Column (2) presents the findings based on a matched sample of overvalued and non-overvalued firms. This study performs one-to-one nearest-neighbor matching based on the covariates used in the baseline regression. Table A1 provides the variable definitions. The t-statistics based on clustered standard errors at the firm level are presented in parentheses. ***, **, and * indicate statistical significance at the 1%, 5%, and 10% levels, respectively.
4.4 Robustness Checks
To ensure that variable definitions or specific modeling choices do not influence the baseline findings, this study performs several additional robustness checks.
Table 8 presents robustness checks using alternative variable definitions. Panel A shows robustness tests with alternative dependent variables. To mitigate the likelihood that changes influence the results in the sales denominator, I re-estimate the baseline model using three alternative measures of R&D investment: R&D expenditures scaled by lagged total assets (RD/Asset), the natural logarithm of one plus R&D expenditures (lnRD), and industry-adjusted R&D intensity (AdjRDI). To construct the industry-adjusted measure, I subtract the average R&D intensity of firms within the same two-digit KSIC industry in each year from the firm’s R&D intensity. As reported in Panel A of Table 8, the coefficient on YoungerCEO × Overvalued remains positive and statistically significant across all specifications. These results indicate that using sales-scaled R&D intensity does not drive the main findings. Panel B presents robustness checks using alternative explanatory variables. First, I examine whether the results are influenced by the age cutoff used to define younger CEOs. The baseline analysis defines YoungerCEO using an age cutoff of 60; however, this cutoff may capture a relatively broad group of CEOs rather than young CEOs. To address this concern, I re-estimate the baseline model using alternative age cutoffs. Specifically, I define YoungerCEO as an indicator that equals 1 if the CEO is younger than 55 or 65 years old. The 55-year cutoff classifies younger CEOs more strictly, whereas the 65-year cutoff examines whether the results remain consistent when the age threshold is relaxed. As reported in columns (1) and (2) of Panel B, the coefficient on YoungerCEO × Overvalued remains positive and statistically significant across both specifications. Notably, the interaction coefficient is larger under the stricter 55-year cutoff, aligning with the interpretation that the R&D response to stock overvaluation is more pronounced among younger CEOs.
Table 8 Robustness checks
| Panel A: Alternative dependent variables | ||||
|---|---|---|---|---|
| (1) RD/Asset (%) | (2) lnRD | (3) AdjRDI | ||
| YoungerCEO | $\beta_Y$ | -0.0296 (-0.44) | -0.0056 (-0.12) | 0.1020 (0.85) |
| Overvalued | $\beta_O$ | 0.2688*** (2.70) | 1.0864*** (3.47) | 0.6273*** (3.50) |
| YoungerCEO × Overvalued | $\beta_{YO}$ | 0.2223** (1.99) | 0.6822** (2.11) | 0.6683*** (2.81) |
| Controls and constant | Yes | Yes | Yes | |
| Firm and Year FEs | Yes | Yes | Yes | |
| # of firm years | 17,551 | 17,551 | 17,551 | |
| # of firms | 2,170 | 2,170 | 2,170 | |
| Within $R2$ | 0.2032 | 0.1993 | 0.0727 | |
| Panel B: Alternative explanatory variables | ||||
| (1) Age < 55 | (2) Age < 65 | (3) Continuous FSE | ||
| YoungerCEO | $\beta_Y$ | 0.0996 (0.80) | 0.0091 (0.06) | 0.0952 (0.75) |
| Overvalued | $\beta_O$ | 0.6321*** (3.49) | 0.6265*** (3.47) | |
| YoungerCEO × Overvalued | $\beta_{YO}$ | 0.7385*** (3.21) | 0.5147* (1.83) | |
| FSE | $\beta_F$ | 0.8467** (2.20) | ||
| YoungerCEO × FSE | $\beta_{YF}$ | 0.4175* (1.94) | ||
| Controls and constant | Yes | Yes | Yes | |
| Firm and Year FEs | Yes | Yes | Yes | |
| # of firm years | 17,551 | 17,551 | 17,551 | |
| # of firms | 2,170 | 2,170 | 2,170 | |
| Panel C: Alternative model specifications | ||
|---|---|---|
| (1) CEO FE | (2) Industry × Year FE | |
| YoungerCEO (βY) | -0.0384 (-0.51) | -0.0094 (-0.12) |
| Overvalued (βO) | 0.6227*** (3.62) | 0.5879*** (2.73) |
| YoungerCEO × Overvalued (βYO) | 0.3580** (2.08) | 0.3135** (1.99) |
| Controls and constant | Yes | Yes |
| Year FE | Yes | No |
| CEO FE | Yes | No |
| Industry × Year FE | No | Yes |
| # of firm years | 17,551 | 17,551 |
| # of firms (CEOs) | (4,032) | 2,170 |
| Within R2 | 0.0734 | 0.1536 |
This table reports the robustness tests. Panel A uses alternative dependent variables: R&D expenditures scaled by lagged total assets (RD/Asset), the natural logarithm of R&D expenditures (lnRD), and industry-adjusted R&D intensity (AdjRDI). Panel B uses alternative explanatory variables: alternative YoungerCEO definitions based on age cutoffs of 55 and 65 years, and the continuous firm-specific misvaluation measure (FSE). Panel C uses alternative model specifications, including CEO fixed effects and industry-by-year fixed effects. For brevity, the coefficients on control variables and constants are not reported. Table A1 provides the variable definitions. The t-statistics based on clustered standard errors at the firm level are reported in parentheses. ***, **, and * indicate statistical significance at the 1%, 5%, and 10% levels, respectively.
I also substitute the overvaluation indicator with the continuous FSE, as shown in column (3) of Panel B. The baseline results may be influenced by the tercile-based classification used to identify overvalued firms. Because the indicator variable considers only firms in the top tercile of the misvaluation distribution, it may overlook differences in the degree of stock misvaluation across firms. To address this concern, I re-estimate the model using the FSE measure and its interaction with YoungerCEO. The interaction term between YoungerCEO and FSE remains positive and statistically significant, thus indicating that the results persist when stock misvaluation is measured using a continuous specification.
Panel C presents robustness checks using alternative model specifications. First, younger CEOs may systematically differ from older CEOs in unobserved managerial characteristics, such as a stronger natural proclivity for innovation (Bostan and Mian, 2019; Yim, 2019; Yim and Kang, 2024). The estimated interaction between YoungerCEO and Overvalued may partly capture CEO-specific heterogeneity rather than a differential response to stock overvaluation. To address this concern, I incorporate CEO fixed effects (e.g., James et al., 2020; Yim and Kang, 2024), which absorb time-invariant CEO characteristics. Due to some CEOs in our dataset serving as CEOs in multiple firms within the same year, the CEO-year combination is not unique, hence precluding the use of a conventional panel estimator based on a unique CEO-year identifier. Consequently, I estimate the model using a high-dimensional fixed-effects estimator that aligns with the data structure (Correia, 2016; Gaure, 2013; Guimarães and Portugal, 2010).5 As reported in column (1), the coefficient on YoungerCEO × Overvalued remains positive and statistically significant, implying that unobserved CEO-specific traits do not influence the observed relationship.
Second, time-varying industry conditions may simultaneously impact both stock valuations and firms’ R&D investment. For example, technological opportunities, industry-wide innovation cycles, or sector-specific demand shocks may result in higher stock prices and increased R&D spending within the same industry-year (Agrawal et al., 2020; Videnord, 2025). If such industry-level dynamics influence both valuation and investment, the baseline results may reflect industry-specific shocks rather than firms’ differential responses to stock overvaluation. To address this concern, I incorporate industry-by-year fixed effects, which absorb all time-varying shocks common to firms within the same industry-year. As reported in column (2), the coefficient on YoungerCEO × Overvalued remains positive and statistically significant, implying that time-varying industry conditions do not account for the results.
4.5 Underlying Mechanisms
The baseline results indicate that younger CEOs significantly increase R&D investment when firms are overvalued. This finding supports Hypothesis 1, which states that younger CEOs exhibit a more pronounced response to stock overvaluation by increasing R&D investment. However, this result alone does not reveal the underlying mechanism. The positive association between stock overvaluation and R&D investment in firms led by younger CEOs is not unique to the catering explanation (Alzahrani and Rao, 2014; Kusnadi and Wei, 2017). The catering hypothesis predicts that younger CEOs increase R&D investment to meet investor expectations during periods of overvaluation, and a similar pattern may also emerge under the equity financing mechanism (e.g., Baker et al., 2003; Morck et al., 1990; Stein, 1996).
If stock overvaluation reduces the cost of equity, firms may be able to raise equity capital more easily and increase R&D investment (e.g., Dong et al., 2021; Li, 2026; Shen et al., 2021), and younger CEOs may exploit this opportunity more aggressively. Therefore, the positive interaction observed in the baseline regressions may indicate either the catering or the equity financing mechanism. To distinguish between these competing explanations, I perform a series of mechanism tests.
4.5.1 Equity Financing Mechanism
I first examine whether the equity financing channel influences the observed relationship. If stock overvaluation facilitates equity issuance, firms may raise more equity capital when their stock is overvalued, potentially leading to increased R&D investment. In this context, younger CEOs may exploit favorable market valuations more aggressively when accessing equity markets, potentially leading to increased equity issuance and subsequent R&D investments.
To examine whether this mechanism accounts for the positive relationship between younger CEOs and stock overvaluation in predicting R&D investment, I investigate the role of equity issuance as a mediator. Specifically, I conduct a two-stage analysis. In the first stage, I examine whether firms led by younger CEOs issue more equity when their stock is overvalued. In the second stage, I examine whether equity issuance is correlated with subsequent R&D investment. Equity issuance (EQUISS) is measured as the sum of increases in paid-in capital and the disposal of treasury shares, minus capital reductions and treasury stock repurchases, scaled by lagged total assets (e.g., Kim, 2021). These components are derived from firms’ cash flow statements.
I estimate the following models:
If the equity financing mechanism operates, three patterns should be observed. First, the interaction between YoungerCEO and Overvalued should positively correlate with EQUISS in Eq. (5). Second, EQUISS should positively correlate with subsequent R&D investment in Eq. (6). Third, once EQUISS is incorporated into Eq. (6), the coefficient on the interaction term should decline in magnitude and become less statistically significant relative to the baseline specification.
Table 9 presents the results. Column 1 displays the first-stage results from Eq. (5). The coefficient on the interaction between YoungerCEO and Overvalued is positive and statistically significant, implying that firms led by younger CEOs often issue more equity when their stock is overvalued. This finding indicates that younger CEOs may leverage favorable market valuations when accessing equity markets. In addition, the coefficient on Overvalued is positive and statistically significant, aligning with prior evidence that overvalued firms are more inclined to issue equity (Kim, 2021). The coefficient on YoungerCEO is also positive, indicating that firms led by younger CEOs may be more inclined to access equity markets, although prior studies have not explicitly documented this pattern in the Korean context.
Table 9 Equity financing mechanism: Mediation test
| First-stage | Second-stage | ||
|---|---|---|---|
| (1) | (2) | ||
| EQUISS | RDIt+1 (%) | ||
| YoungerCEO | $\beta_Y$ | 0.0063*** (3.11) | 0.0827 (0.68) |
| Overvalued | $\beta_O$ | 0.0195*** (5.92) | 0.6301*** (3.49) |
| YoungerCEO × Overvalued | $\beta_{YO}$ | 0.0150*** (3.28) | 0.6819*** (2.70) |
| FirmSIZE | $\gamma_1$ | -0.0055*** (-5.39) | 0.3017*** (4.59) |
| FirmAGE | $\gamma_2$ | -0.0051*** (-2.68) | -0.6260*** (-5.60) |
| TANG | $\gamma_3$ | -0.0585*** (-7.69) | 0.8598** (1.89) |
| LEV | $\gamma_4$ | -0.0526*** (-7.34) | -3.3614*** (-7.81) |
| ROA | $\gamma_5$ | -0.2755*** (-11.73) | 8.5702*** (7.03) |
| GROWTH | $\gamma_6$ | 0.0751*** (9.30) | 0.5331 (1.55) |
| FOR | $\gamma_7$ | -0.0528*** (-4.12) | 0.9926 (1.06) |
| LARGE | $\gamma_8$ | -0.0202** (-2.56) | -3.1095*** (-6.88) |
| BETA | $\gamma_9$ | 0.0076** (2.13) | 0.5358*** (3.80) |
| EQUISS | $\gamma_E$ | 0.3832 (0.84) | |
| Constant | $\beta_0$ | 0.1831*** (8.88) | -0.5211 (-0.43) |
| Firm FE | Yes | Yes | |
| Year FE | Yes | Yes | |
| # of firm-years | 17,551 | 17,551 | |
| # of firms | 2,170 | 2,170 | |
| Within $R2$ | 0.1067 | 0.2135 |
This table examines whether the effect of stock overvaluation on R&D investment operates through equity financing. Column (1) estimates the effect of stock overvaluation and CEO age on equity issuance (EQUISS). Column (2) subsequently incorporates equity issuance as an additional explanatory variable when estimating R&D investment to examine whether equity issuance mediates the relationship between stock overvaluation and R&D investment. Table A1 provides the variable definitions. The t-statistics based on clustered standard errors at the firm level are presented in parentheses. ***, **, and * indicate statistical significance at the 1%, 5%, and 10% levels, respectively.
Column (2) reports the second-stage results from Eq. (6). The coefficient on EQUISS is statistically insignificant, indicating that equity issuance does not correlate with higher R&D investment in the subsequent period. In addition, the coefficient on YoungerCEO × Overvalued remains positive and statistically significant even after controlling for equity issuance. Its magnitude and statistical significance are largely unchanged from the baseline results in Table 5. These results provide minimal evidence that equity issuance mediates the relationship between younger CEOs, stock overvaluation, and R&D investment. Although firms led by younger CEOs are more likely to issue equity when their stock is overvalued, this equity issuance does not result in increased R&D investment. These findings indicate that the higher R&D investment observed among younger CEOs in overvalued firms is unlikely to be attributed to the equity financing channel.
To further examine the equity financing mechanism, I subsequently consider firms’ financial constraints. If stock overvaluation increases R&D investment by making equity financing more accessible, the effect should be stronger for financially constrained firms. Financially constrained firms face greater difficulty obtaining external capital, making them more likely to benefit from favorable equity market conditions. According to this mechanism, the positive relationship between stock overvaluation and R&D investment should become more pronounced as firms encounter greater financial constraints.
Table 10 Equity financing mechanism: The role of financial constraints
| Dependent variable = RDIt+1 (%) | ||||
|---|---|---|---|---|
| (1) | (2) | (3) | ||
| KZ-index | SA-index | No dividend | ||
| YoungerCEO | $\beta_Y$ | 0.0506 (0.33) | 0.1780 (1.60) | −0.0868 (−0.70) |
| Overvalued | $\beta_O$ | 0.6553*** (2.99) | 0.7778*** (3.49) | 0.6363*** (3.29) |
| YoungerCEO × Overvalued | $\beta_{YO}$ | 0.6275*** (2.84) | 0.7052*** (3.06) | 0.6312*** (2.75) |
| FC | $\beta_C$ | −0.5890*** (−2.96) | −0.3749* (−1.68) | −0.2157*** (−2.59) |
| YoungerCEO × FC | $\beta_{YC}$ | −0.1955* (−1.94) | −0.4677** (−2.11) | −0.4431* (−1.68) |
| Overvalued × FC | $\beta_{OC}$ | 0.0535 (0.15) | −0.0352 (−0.08) | 0.0634 (0.62) |
| YoungerCEO × Overvalued × FC | $\beta_{YOC}$ | 0.3026 (0.70) | 0.4039 (0.80) | 0.5248 (1.07) |
| Controls and constant | Yes | Yes | Yes | |
| Firm and year FEs | Yes | Yes | Yes | |
| # of firm years | 17,551 | 17,551 | 17,551 | |
| # of firms | 2,170 | 2,170 | 2,170 | |
| Within $R2$ | 0.2151 | 0.2175 | 0.2133 | |
This table examines whether the effect of stock overvaluation on R&D investment is influenced by the equity financing channel under financial constraints. Column (1) estimates the specification using the KZ index as the proxy for financial constraints. Column (2) employs the SA index as an alternative measure of financial constraints. Column (3) employs a no-dividend indicator as an additional proxy for financial constraints. For brevity, the coefficients on control variables and constants are not reported. Table A1 provides the variable definitions. The t-statistics based on clustered standard errors at the firm level are presented in parentheses. ***, **, and * indicate statistical significance at the 1%, 5%, and 10% levels, respectively.
To capture financial constraints, I employ three proxies from the corporate finance literature. The first measure is the Kaplan and Zingales (1997) index (KZ index), which captures firms’ dependence on external financing. Following Baker et al. (2003), I employ a modified version of the KZ index that excludes Tobin’s Q from the original specification. The index is computed as follows:
where A is total assets, CF denotes cash flows, DIV is cash dividends, C represents cash holdings, and LEV is book leverage.
The second measure is the Hadlock and Pierce (2010) index (SA index), which is constructed based on firm size and age and is extensively used as a parsimonious proxy for financial constraints. The SA index is constructed in accordance with the specification proposed by Hadlock and Pierce (2010), with the corresponding formula expressed as shown below.
where SIZE denotes the natural logarithm of total assets measured in units of 100 million KRW, and AGE is firm age.
The final measure is a dividend-based indicator. Firms that do not pay dividends are frequently regarded as more financially constrained because they retain internal resources to finance investment rather than distribute cash to shareholders. Following prior studies, I classify firms that do not pay dividends as financially constrained (Almeida et al., 2004; Shin and Kim, 2008).
I augment the baseline regression model by incorporating financial constraints and interaction terms. Specifically, I incorporate a triple interaction term among YoungerCEO, Overvalued, and FC. If the equity financing mechanism accounts for the increased R&D investment observed among younger CEOs in overvalued firms, the effect should be more pronounced when firms encounter greater financial constraints. In this context, the coefficient on the triple interaction term YoungerCEO × Overvalued × FC should be positive and statistically significant. The results are reported in Table 10. The coefficient on YoungerCEO × Overvalued × FC is statistically insignificant across all three specifications. This finding indicates that financial constraints do not amplify the R&D response of younger CEOs to stock overvaluation. These results provide minimal support for the equity financing mechanism. Rather, they indicate that the increased R&D investment observed among younger CEOs in overvalued firms is unlikely to be due to financing considerations.
4.5.2 Catering Mechanism
To determine whether the positive relationship between stock overvaluation and R&D investment reflects managerial incentives to meet investor expectations, I examine the role of investor horizon. Prior studies indicate that managers of overvalued firms may increase investment to justify elevated valuations when investors focus on current stock prices (Alzahrani and Rao, 2014; Jensen, 2005; Mrad et al., 2024; Polk and Sapienza, 2009). Alzahrani and Rao (2014) contend that this catering incentive should be stronger when shareholders have shorter horizons, as these investors are more concerned with current stock prices. In the context of this study, the catering hypothesis implies that the stronger R&D investment observed among younger CEOs in overvalued firms should be more pronounced in short-horizon investor environments.
I use two measures to assess the short-horizon investor environment. First, following Alzahrani and Rao (2014), I use stock turnover to measure investor horizon. Specifically, the turnover ratio is calculated as the average monthly ratio of shares traded to shares outstanding over the fiscal year. A higher turnover ratio indicates that shares are traded more frequently. Based on the turnover ratios’ annual distribution, I construct an indicator variable, ShortHorizon, that equals 1 if a firm’s turnover ratio falls in the top tercile and 0 otherwise.
Second, to address the concern that stock turnover in the Korean market may partly reflect active trading by retail investors, I develop an alternative measure based on foreign investor turnover. Data Guide provides the data required to construct this measure. Based on previous Korean studies on foreign investor horizons (Kim and Jang, 2012; Kim and Park, 2017; Lee et al., 2025), I calculate the monthly turnover ratio of foreign investors as follows:
where m and d denote the month and trading day, respectively. D represents the number of trading days in month m. FB and FS represent the daily buy and sell amounts of foreign investors, respectively. FMV denotes the market value of shares held by foreign investors on day d. The data required to construct this measure are obtained from Data Guide. A higher value of Foreign Turnoverim indicates that foreign investors trade their holdings more frequently, implying a shorter investment horizon.
I then aggregate the monthly foreign investor turnover ratios to the annual level:
Based on the annual distribution of Foreign Turnoverit, I define Short Foreign as an indicator that equals 1 if a firm’s foreign investor turnover ratio falls in the top tercile in a given year, and 0 otherwise.
Table 11 presents the analysis results pertaining to the catering explanation. Column (1) reports the results using ShortHorizon, which is based on overall stock turnover. In both columns, the triple interaction terms, YoungerCEO × Overvalued × ShortHorizon and YoungerCEO × Overvalued × Short Foreign, are positive and statistically significant. The positive coefficients on the triple interaction terms indicate that younger CEOs are more inclined to increase R&D investment in overvalued firms when investor horizons are shorter.
Table 11 Catering mechanism: The role of investor horizon
| Dependent variable = RDIt+1 (%) | |||
|---|---|---|---|
| (1) | (2) | ||
| ShortHorizon | ShortForeign | ||
| YoungerCEO | $\beta_Y$ | 0.2030 (1.29) | 0.1615 (1.00) |
| Overvalued | $\beta_O$ | 0.7818*** (3.45) | 0.7664*** (3.30) |
| YoungerCEO × Overvalued | $\beta_{YO}$ | 0.5356** (2.47) | 0.5554** (2.53) |
| Short | $\beta_S$ | 0.2203 (1.51) | -0.0075 (-0.21) |
| YoungerCEO × Short | $\beta_{YS}$ | 0.2891 (1.54) | 0.2002 (1.03) |
| Overvalued × Short | $\beta_{OS}$ | 0.4826 (1.35) | 0.5233* (1.69) |
| YoungerCEO × Overvalued × Short | $\beta_{YOS}$ | 0.3689*** (2.82) | 0.3557*** (2.60) |
| Controls and constant | Yes | Yes | |
| Firm and year FEs | Yes | Yes | |
| # of firm years | 17,551 | 17,551 | |
| # of firms | 2,170 | 2,170 | |
| Within $R2$ | 0.2137 | 0.2144 | |
This table reports the results of the catering mechanism test. Column (1) uses ShortHorizon, which is based on overall stock turnover and equals 1 if a firm’s stock turnover ratio falls in the top tercile of its annual distribution and 0 otherwise. Column (2) uses ShortForeign, which is based on foreign investor turnover and equals one if a firm’s foreign investor turnover ratio falls in the top tercile of its annual distribution, and zero otherwise. For expositional simplicity, both variables are reported as Short in the table. For brevity, the coefficients on control variables and constants are not reported. Table A1 provides the variable definitions. The t-statistics based on standard errors clustered at the firm level are presented in parentheses. ***, **, and * indicate statistical significance at the 1%, 5%, and 10% levels, respectively.
These findings align with the catering hypothesis. When investors focus more on current stock prices, managers of overvalued firms may have stronger incentives to take visible actions that justify their high valuations. The positive coefficient on YoungerCEO × Overvalued × ShortHorizon indicates that younger CEOs are more likely to increase R&D investment in overvalued firms when investor horizons are shorter. This pattern is consistent with Polk and Sapienza (2009) and Jensen’s (2005) assertion that managers of overvalued firms may accommodate investors by increasing investment to support high valuations.
The results based on foreign investor turnover further reinforce this interpretation. Because total stock turnover in Korea may partly capture retail trading or speculative market attention, the foreign-investor-based measure provides an effective supplementary test. The positive coefficient in column (2) indicates that the R&D response of younger CEOs to stock overvaluation is stronger when foreign investors have shorter investment horizons. This result indicates that the main finding is not limited to the overall stock turnover measure and provides additional evidence supporting the catering-based interpretation.
These findings highlight the significance of managerial heterogeneity in determining how firms respond to stock overvaluation. Although prior studies typically emphasize the influence of investor horizon on corporate investment decisions, the results indicate that market pressure alone does not uniformly translate into investment responses across firms. Rather, CEO characteristics may significantly influence how valuation signals are interpreted and acted upon. Younger CEOs, in particular, are more likely to respond to short-horizon investor environments by increasing R&D investment when their firms are overvalued.
Ⅴ. Conclusion
This study examines whether CEOs of varying ages exhibit distinct responses to stock overvaluation in their R&D investment decisions. Utilizing Korean listed firms from 2012 to 2022, I ascertain that stock overvaluation is positively correlated with R&D investment, with this relationship significantly stronger in firms led by younger CEOs. These results remain robust across multiple identification strategies, including system GMM estimation and additional robustness tests. Further analysis fails to yield compelling evidence that the equity financing channel primarily explains the observed relationship. Rather, the overall pattern of evidence aligns more with a catering-based interpretation. In particular, the R&D response to stock overvaluation is stronger when firms have a greater presence of short-horizon investors, implying that market expectations may influence younger CEOs’ R&D investment decisions.
5.1 Implications
These findings indicate that the real effects of stock misvaluation depend on CEOs’ interpretations of market signals. Although prior research frequently assumes that managers respond similarly to stock overvaluation (e.g., Dong et al., 2021; Li, 2026; Luo et al., 2022), the results indicate that such responses vary systematically with CEO characteristics. Particularly, younger CEOs are more likely to increase R&D investment when their firms’ stock prices exceed fundamental values. This perspective also provides a new interpretation of prior evidence linking CEO age to innovation outcomes. Rather than reflecting a purely intrinsic managerial preference for innovation, the results indicate that part of younger CEOs’ innovation behavior may stem from a stronger response to market valuation signals. Collectively, the findings highlight the significance of managerial interpretation in comprehending how stock market signals influence corporate innovation decisions.
Regarding practical implications, the findings propose that boards and investors should focus more on executive characteristics when evaluating corporate responses to market signals. The results indicate that younger CEOs are more inclined to increase R&D investment when their firms’ stock prices are overvalued, implying that managerial traits influence how firms interpret and respond to valuation signals. When temporary market conditions influence decisions, this responsiveness in innovation-intensive industries can either enhance long-term value creation or result in excessive investment.
The findings have important implications for innovation policy and R&D support programs. If R&D investment is partially influenced by stock market signals rather than solely by technological opportunities, policy frameworks that significantly rely on quantitative input measures, such as R&D spending levels, may not adequately reflect the underlying motivations for firms’ R&D investment. Incorporating qualitative assessment criteria, such as project continuity, technological coherence, and alignment with long-term development goals, may aid in the effectiveness of public R&D evaluation systems.
These implications are particularly significant in contexts such as Korea, where firms exhibit exceptionally high R&D intensity but uneven conversion of R&D inputs into innovation outcomes (Choi et al., 2024). In such contexts, strong performance pressure and relatively short CEO tenures may amplify managerial sensitivity to stock market signals. Recognizing how managerial characteristics interact with valuation signals may aid policymakers in designing governance mechanisms that mitigate valuation-driven distortions while promoting long-term innovation.
5.2 Limitations and Future Research
Despite its contributions, this study has several limitations that provide avenues for future research. First, CEO age represents only one dimension of managerial interpretation. Future research could examine other managerial characteristics that influence how executives respond to market signals, such as CEO tenure, compensation structure, career concerns, and individual risk preferences. Second, although this study indicates that younger CEOs respond more strongly to stock overvaluation by increasing R&D investment, the underlying reasons for this behavior remain unanswered. Younger CEOs may experience stronger career concerns, greater reputational incentives, or stronger pressure to meet market expectations. Future research could further explore these mechanisms by examining how managerial incentives and governance structures interact with stock overvaluation.
Third, although this study focuses on R&D investment decisions, it raises an important question concerning the efficiency of valuation-driven innovation. If R&D spending increases primarily in response to stock overvaluation, such investment may not always result in enhanced innovation outcomes. Future research could investigate whether valuation-induced R&D investment improves innovation efficiency or causes overinvestment in R&D. Fourth, although I employ a firm-specific measure of stock overvaluation, other approaches may provide complementary insights. For example, alternative approaches to measuring misvaluation include the residual income model or mutual fund flow measures (Bonaimé et al., 2014; Dong et al., 2021; Jin, 2022; Luo et al., 2022). However, the availability of detailed mutual fund flow data is limited in the Korean market, making this approach ineffective.
Lastly, because the analysis is based on Korean firms, caution should be exercised when generalizing the findings to other institutional contexts. Future research could benefit from applying this framework to firms operating in different institutional settings to gain a deeper comprehension of how governance structures and capital market conditions influence valuation-driven innovation behavior.
Appendix
Table A1 Variable definitions
| Variable | Definition |
|---|---|
| Panel A: Main variables and controls | |
| RDI | R&D expenditures (R&D costs expensed on the income statement and those capitalized as intangible assets) / total sales |
| CEO age | Fiscal year – the CEO’s year of birth + 1 |
| Younger CEO | Binary variable taking a value of 1 if the CEO is younger than 60 years old, and 0 otherwise |
| FSE | The firm-specific misvaluation component of the natural log of the M/B ratio |
| Overvalued | Binary variable taking a value of 1 if the stock misvaluation is in the top tercile of its annual distribution, and 0 otherwise |
| FirmSIZE | The natural log of total assets |
| FirmAGE | The natural log of firm age (= fiscal year – the year of establishment + 1) |
| TANG | Tangible assets / total assets |
| LEV | Total liabilities / total assets |
| ROA | Earnings before interest and tax / total assetst–1 |
| GROWTH | Annual sales growth rate (= ∆Total sales / total salest−1) |
| FOR | Proportion of foreign investors’ shareholdings |
| LARGE | Proportion of the largest shareholders, including related parties |
| BETA | The slope of a market model regression using daily returns over one-year period |
| Panel B: Additional variables | |
| RD/Asset | R&D expenditures / total assetst-1 |
| lnRD | The natural log of (1 + R&D expenditures) |
| AdjRDI | Industry-adjusted RDI, measured as RDI minus the mean RDI of firms in the same KSIC 2-digit industry year |
| EQUISS | (Paid-in capital increases + disposal of treasury shares – capital reductions – treasury stock repurchases) / total assetst–1 |
| KZ index | Kaplan-Zingales index (Baker et al., 2003; Kaplan and Zingales, 1997) |
| SA index | Hadlock-Pierce index (Hadlock and Pierce, 2010) |
| No dividend | Binary variable taking a value of 1 if the firm does not pay dividends in a given year, and 0 otherwise |
| FC | Binary variable taking a value of 1 if the firm is financially constrained. For the KZ and SA indices, firms in the top tercile of their annual distributions are classified as financially constrained. |
| ShortHorizon | Binary variable taking a value of 1 if the firm’s stock turnover falls in the top tercile of its annual distribution, and 0 otherwise |
| ShortForeign | Binary variable taking a value of 1 if a firm’s foreign investor turnover falls in the top tercile of its annual distribution, and zero otherwise |
Table A2 Parameter estimates for stock misvaluation
| Panel A. Variables for measuring stock misvaluation | |||||||
|---|---|---|---|---|---|---|---|
| Variable | Mean | SD | p01 | p25 | p50 | p75 | p99 |
| m | 25.6478 | 1.4039 | 22.9748 | 24.7357 | 25.4316 | 26.3184 | 30.1115 |
| b | 25.4154 | 1.4915 | 22.3146 | 24.4759 | 25.2072 | 26.1441 | 30.1435 |
| lnNI+ | 22.9269 | 1.7023 | 18.8204 | 21.8979 | 22.8707 | 23.8804 | 27.5481 |
| Loss | 0.3210 | 0.4669 | 0.0000 | 0.0000 | 0.0000 | 1.0000 | 1.0000 |
| LEV_RK | 0.3922 | 0.2432 | 0.0176 | 0.1854 | 0.3638 | 0.5793 | 0.9180 |
| Panel B. Misvaluation model parameter estimates | ||||||||||||
|---|---|---|---|---|---|---|---|---|---|---|---|---|
| Two-digit KSIC code | ||||||||||||
| 10 | 11 | 13 | 14 | 17 | 20 | 21 | 22 | 23 | 24 | 25 | 26 | |
| $\mathbb{E}_t[\hat{\alpha}_0]$ | 0.68 | 1.68 | 4.16 | 2.62 | 4.41 | 1.55 | 1.86 | 0.57 | 3.27 | 1.61 | 0.87 | 0.92 |
| (0.97) | (0.84) | (1.41) | (1.48) | (2.69) | (3.00) | (2.23) | (0.59) | (3.06) | (2.43) | (0.85) | (2.43) | |
| $\mathbb{E}_t[\hat{\alpha}_1]$ | 0.77 | 0.61 | 0.54 | 0.58 | 0.55 | 0.71 | 0.82 | 0.81 | 0.57 | 0.66 | 0.81 | 0.77 |
| (7.35) | (2.63) | (2.09) | (2.59) | (3.89) | (10.95) | (8.34) | (7.97) | (4.88) | (9.11) | (5.67) | (18.01) | |
| $\mathbb{E}_t[\hat{\alpha}_2]$ | 0.22 | 0.33 | 0.07 | 0.25 | 0.05 | 0.21 | 0.09 | 0.15 | 0.18 | 0.22 | 0.13 | 0.19 |
| (2.61) | (0.99) | (0.31) | (1.98) | (0.53) | (3.80) | (1.50) | (1.76) | (1.75) | (3.74) | (1.11) | (5.72) | |
| $\mathbb{E}_t[\hat{\alpha}_3]$ | 0.00 | −0.01 | 0.00 | −0.01 | 0.01 | −0.02 | 0.04 | −0.02 | −0.02 | −0.01 | 0.00 | −0.03 |
| (−0.07) | (−0.27) | (0.10) | (−0.47) | (0.31) | (−1.30) | (1.63) | (−0.81) | (−0.84) | (−0.57) | (0.00) | (−2.49) | |
| $\mathbb{E}_t[\hat{\alpha}_4]$ | 0.26 | 0.44 | −0.35 | 0.09 | 0.15 | 0.51 | 0.25 | 1.19 | 0.36 | 0.30 | 0.68 | 0.73 |
| (0.46) | (0.51) | (−0.27) | (0.16) | (0.19) | (1.52) | (0.64) | (2.55) | (0.59) | (0.71) | (1.05) | (3.52) | |
| R2 | 0.82 | 0.86 | 0.68 | 0.73 | 0.52 | 0.83 | 0.61 | 0.84 | 0.78 | 0.85 | 0.66 | 0.82 |
| Two-digit KSIC code | ||||||||||||
| 27 | 28 | 29 | 30 | 31 | 33 | 35 | 41 | 42 | 46 | 47 | 49 | |
| $\mathbb{E}_t[\hat{\alpha}_0]$ | 4.28 | 1.30 | 1.51 | 1.01 | 1.22 | 7.07 | 2.55 | 1.12 | −0.14 | 2.44 | 2.26 | 1.30 |
| (3.04) | (1.52) | (2.44) | (1.56) | (1.31) | (3.86) | (3.11) | (1.23) | (−0.01) | (3.98) | (2.38) | (0.57) | |
| $\mathbb{E}_t[\hat{\alpha}_1]$ | 0.47 | 0.76 | 0.71 | 0.75 | 0.73 | 0.46 | 0.35 | 0.78 | 0.83 | 0.65 | 0.65 | 0.77 |
| (3.28) | (7.96) | (10.56) | (10.57) | (5.00) | (2.33) | (2.00) | (7.02) | (3.41) | (9.59) | (4.71) | (4.14) | |
| $\mathbb{E}_t[\hat{\alpha}_2]$ | 0.22 | 0.17 | 0.22 | 0.18 | 0.22 | 0.02 | 0.08 | 0.13 | 0.23 | 0.20 | 0.23 | 0.14 |
| (2.57) | (2.27) | (4.17) | (3.19) | (1.64) | (0.51) | (0.77) | (1.24) | (1.31) | (3.59) | (2.12) | (0.69) | |
| $\mathbb{E}_t[\hat{\alpha}_3]$ | −0.05 | −0.01 | −0.02 | 0.00 | −0.02 | −0.01 | −0.00 | 0.00 | 0.04 | −0.01 | −0.02 | 0.01 |
| (−1.94) | (−0.49) | (−1.35) | (−0.08) | (−0.77) | (−0.58) | (−0.25) | (−0.29) | (0.94) | (−0.76) | (−0.63) | (0.14) | |
| $\mathbb{E}_t[\hat{\alpha}_4]$ | 0.54 | 0.53 | 0.56 | 0.24 | 0.70 | −1.82 | −1.11 | 0.29 | 0.02 | 0.21 | −0.11 | −0.36 |
| (1.13) | (1.06) | (1.87) | (0.69) | (1.00) | (−2.17) | (−2.00) | (0.63) | (0.02) | (0.61) | (0.05) | (−0.32) | |
| R2 | 0.49 | 0.78 | 0.72 | 0.85 | 0.93 | 0.74 | 0.72 | 0.80 | 0.80 | 0.73 | 0.86 | 0.91 |
| Two-digit KSIC code | ||||||||||||
| 58 | 59 | 60 | 61 | 62 | 63 | 70 | 71 | 72 | 73 | 75 | 85 | |
| $\mathbb{E}_t[\hat{\alpha}_0]$ | 1.84 | 2.51 | 1.75 | 1.41 | 1.51 | 0.18 | 3.03 | 0.58 | 0.56 | 6.94 | −0.72 | 4.02 |
| (2.63) | (1.81) | (1.25) | (1.61) | (0.87) | (0.27) | (1.45) | (0.69) | (0.36) | (2.67) | (−0.25) | (2.53) | |
| $\mathbb{E}_t[\hat{\alpha}_1]$ | 0.75 | 0.69 | 0.82 | 0.72 | 0.74 | 0.84 | 0.67 | 0.81 | 0.75 | 0.30 | 0.89 | 0.38 |
| (8.06) | (5.06) | (4.34) | (4.27) | (4.41) | (4.36) | (3.35) | (7.59) | (2.34) | (1.52) | (3.45) | (2.46) | |
| $\mathbb{E}_t[\hat{\alpha}_2]$ | 0.17 | 0.20 | 0.03 | 0.19 | 0.17 | 0.23 | 0.29 | 0.17 | 0.27 | 0.24 | 0.30 | 0.36 |
| (2.60) | (1.77) | (0.45) | (1.14) | (1.54) | (1.81) | (1.50) | (1.93) | (1.10) | (0.89) | (1.38) | (2.44) | |
| $\mathbb{E}_t[\hat{\alpha}_3]$ | −0.02 | −0.05 | −0.02 | 0.02 | −0.02 | 0.01 | −0.01 | −0.03 | 0.01 | −0.03 | 0.00 | −0.03 |
| (−0.85) | (−1.35) | (−0.35) | (0.29) | (−0.59) | (0.22) | (−0.10) | (−0.78) | (0.17) | (−0.50) | (−0.03) | (−1.14) | |
| $\mathbb{E}_t[\hat{\alpha}_4]$ | 0.55 | 0.11 | 1.62 | 1.00 | 0.47 | 0.52 | −1.00 | 1.02 | 0.56 | −0.67 | 0.09 | 0.69 |
| (1.30) | (0.12) | (1.64) | (1.16) | (0.68) | (0.45) | (−1.13) | (2.12) | (0.34) | (−0.42) | (−0.19) | (0.57) | |
| R2 | 0.68 | 0.77 | 0.90 | 0.97 | 0.71 | 0.86 | 0.67 | 0.83 | 0.77 | 0.63 | 0.89 | 0.89 |
This table presents the results of estimating stock misvaluation using the method of Rhodes-Kropf et al. (2005). Panel A presents the summary statistics for the variables adopted in the valuation regression. Panel B provides the average industry-year-specific regression coefficients and the R2 values from estimating the model within each two-digit KSIC industry and year. The reported coefficients and R2 values are averaged across industries over the sample period.
Table A3 Covariate mean differences before and after PSM
| Before matching | After matching | |||||
|---|---|---|---|---|---|---|
| Treated | Control | Diff. | Treated | Control | Diff. | |
| Panel A. Covariate balance between firms with younger and older CEOs | ||||||
| FirmSIZE | 19.5253 | 18.9810 | 0.5443*** | 19.5212 | 19.5116 | 0.0097 |
| FirmAGE | 3.3794 | 3.0927 | 0.2867*** | 3.3789 | 3.3694 | 0.0095 |
| TANG | 0.3439 | 0.2760 | 0.0679*** | 0.3435 | 0.3462 | −0.0027 |
| LEV | 0.4372 | 0.4192 | 0.0180*** | 0.4371 | 0.4383 | −0.0012 |
| ROA | 0.0378 | 0.0263 | 0.0115*** | 0.0378 | 0.0374 | 0.0004 |
| GROWTH | 0.0978 | 0.1485 | −0.0507*** | 0.0979 | 0.1005 | −0.0026 |
| FOR | 0.0729 | 0.0590 | 0.0139*** | 0.0728 | 0.0717 | 0.0011 |
| LARGE | 0.4269 | 0.3814 | 0.0455*** | 0.4268 | 0.4116 | 0.0152 |
| BETA | 0.8264 | 0.8652 | −0.0387*** | 0.8267 | 0.8209 | 0.0058 |
| # of firm years | 5,644 | 11,907 | 5,639 | 5,639 | ||
| Panel B. Covariate balance between overvalued and non-overvalued firms | ||||||
| FirmSIZE | 19.2177 | 19.1253 | 0.0924*** | 19.2174 | 19.2102 | 0.0072 |
| FirmAGE | 3.0856 | 3.2346 | −0.1489*** | 3.0859 | 3.0909 | −0.0050 |
| TANG | 0.2834 | 0.3051 | −0.0217*** | 0.2833 | 0.2846 | −0.0012 |
| LEV | 0.4291 | 0.4229 | 0.0062 | 0.4292 | 0.4318 | −0.0026 |
| ROA | 0.0361 | 0.0269 | 0.0092*** | 0.0361 | 0.0349 | 0.0012 |
| GROWTH | 0.1702 | 0.1132 | 0.0570*** | 0.1699 | 0.1644 | 0.0055 |
| FOR | 0.0801 | 0.0552 | 0.0250*** | 0.0800 | 0.0793 | 0.0007 |
| LARGE | 0.3777 | 0.4051 | −0.0274*** | 0.3776 | 0.3791 | −0.0015 |
| BETA | 0.9419 | 0.8082 | 0.1337*** | 0.9419 | 0.9362 | 0.0057 |
| # of firm years | 5,847 | 11,704 | 5,844 | 5,844 | ||
This table reports the covariate balance between treated and control firms before and after matching, based on two propensity score matching procedures. Panel A compares firms with older CEOs (treated) with those led by younger CEOs (control), whereas Panel B compares overvalued firms (treated) with non-overvalued firms (control). All control variables used in the baseline regression are incorporated as covariates in the matching procedure. ***, **, and * indicate statistical significance at the 1%, 5%, and 10% levels, respectively.
저자 약력
∙ Jeongdae Yim is a contract professor at the School of Business Administration, Kyungpook National University. He received his bachelor’s, master’s, and doctoral degrees from Kyungpook National University. His research interests include corporate innovation, environmental technological innovation, and corporate finance.