
.jpeg)
The Same Wind, Different Sails: CEO Business Education, Stock Overvaluation, and R&D Investment in South Korea
1 경북대학교 경영학부 Kyungpook National University(jdyim@knu.ac.kr)
DOI: https://doi.org/10.17287/kmr.2026.55.5.1967
Abstract
This study examines how stock overvaluation changes the relation between CEO business educational background and R&D investment. CEO business education may improve capital allocation and financing decisions, but it may also increase caution toward uncertain long-horizon projects such as R&D. Using a sample of Korean listed firms from 2011 to 2023, we find that business-educated CEOs are associated with lower R&D investment when firms are not overvalued, whereas they are associated with higher R&D investment when firms are overvalued. This result supports a reversal hypothesis rather than an amplification or mitigation hypothesis. The finding is robust to dynamic panel estimation, instrumental variable estimation, propensity score matching, alternative R&D measures, alternative overvaluation definitions, positive-R&D sample restrictions, and industry-by-year fixed effects. Mechanism tests show that the positive association between CEO business education and R&D investment among overvalued firms is concentrated among firms with short-horizon investors, regardless of financial constraint status. These findings are difficult to reconcile with a pure equity-financing explanation and are more consistent with a catering-based interpretation. Further tests show that the reversal pattern does not differ significantly by CEO ownership status or Chaebol affiliation. Overall, this study shows that CEO business education does not have a fixed implication for R&D investment. Its effect depends on valuation conditions, and the evidence suggests that the R&D response of business-educated CEOs under overvaluation is more consistent with catering incentives than with financing opportunities alone.
I. Introduction
Research and development (R&D) investment is a key source of corporate innovation. Yet such investment is difficult to justify at the time the decision is made. R&D requires current resource commitments, while its expected benefits are uncertain and distant. Unlike many other investments, R&D projects often provide limited observable signals about their economic value before resources are committed (Chan et al., 2001; Hottenrott et al., 2016). This creates a difficult managerial problem. Firms must invest before they can know whether the underlying technology will succeed or whether the project will generate future cash flows. For this reason, R&D investment relies heavily on managerial judgment when project value is difficult to verify ex ante (Alzahrani and Rao, 2014; Custódio and Metzger, 2014; Czarnitzki and Toole, 2011).
This reliance on managerial judgment makes CEO characteristics particularly relevant. Upper echelons theory suggests that corporate decisions reflect how top managers interpret the conditions they face (Hambrick, 2007; Hambrick and Mason, 1984). This perspective is especially relevant for R&D investment, where decision makers must evaluate uncertain projects without clear evidence of future value. Among CEO characteristics, educational background is particularly important because it shapes how managers process information and assess investment opportunities. A business educational background is especially relevant in this setting because it can expose managers to concepts related to financing, capital allocation, and valuation (Gupta, 2022). Such training may affect how CEOs approach R&D investment when the economic value of R&D projects is difficult to verify (Kim, 2025; Miller and Xu, 2019).
A business educational background does not imply a single direction for R&D investment. It may help CEOs evaluate investment opportunities and secure financial resources for projects whose value is difficult to verify (Dong et al., 2025; Graham et al., 2013; Gupta, 2022; Gupta et al., 2021). R&D often requires sustained funding before returns become visible. CEOs with business training may therefore be better positioned to assess financing conditions and allocate resources to uncertain projects. At the same time, business education may increase caution toward R&D. It may also make CEOs more attentive to measurable outcomes and short-term performance pressure (Kim, 2025; Loukil and Yousfi, 2022; Miller and Xu, 2019). These concerns matter for R&D because current expenditures are visible, while future benefits remain uncertain. The relation between CEO business educational background and R&D investment is therefore theoretically ambiguous.
Stock overvaluation provides a setting in which this ambiguity becomes especially important. Overvaluation changes both the financing conditions and the market incentives surrounding R&D investment. When a firm is overvalued, external equity becomes less costly, which can ease financing constraints and make it easier to fund uncertain projects (Baker et al., 2003; McLean and Zhao, 2014; Stein, 1996). At the same time, overvaluation may increase managerial incentives to justify optimistic market expectations and sustain high stock prices (Jensen, 2005; Polk and Sapienza, 2009). R&D investment is particularly relevant under these conditions because investors may view it as a visible commitment to future growth. Thus, stock overvaluation may change how business-educated CEOs apply their training in financing and capital allocation to R&D decisions.
Prior research has paid limited attention to whether the effect of CEO business educational background on R&D investment depends on stock market valuation conditions. Studies on CEO characteristics show that managerial traits affect corporate policies (e.g., Barker and Mueller, 2002; Darmadi, 2013; Graham et al., 2013; Kallias et al., 2023), but they often estimate average trait effects. Studies on stock overvaluation show that misvaluation affects real investment through financing conditions or managerial incentives (Baker et al., 2003; Dang and Xu, 2018; Dong et al., 2021; Duong, 2024; Li, 2026; Shen et al., 2021), but they often treat the managerial response as homogeneous. This leaves an important gap. Stock overvaluation may not translate into R&D investment mechanically. Its effect may depend on who interprets valuation signals and how those signals are converted into investment decisions. This study examines whether stock overvaluation changes the relation between CEO business educational background and R&D investment.
To address this question, we use a sample of Korean listed firms from 2011 to 2023. The baseline results reveal a reversal pattern. Business-educated CEOs are associated with lower R&D investment when firms are not overvalued, whereas they are associated with higher R&D investment than other CEOs among overvalued firms. The reversal pattern remains robust in analyses that account for R&D persistence, mitigate potential reverse causality concerns, address endogenous CEO appointment, and reduce observable selection bias. It also holds under alternative measures of R&D investment, alternative definitions of overvaluation, restrictions to firms with positive R&D expenditure, and industry-by-year fixed effects.
We next examine why this reversal occurs. Stock overvaluation can affect R&D investment by easing equity financing or by strengthening incentives to respond to optimistic market expectations. To distinguish these channels, we examine whether the reversal pattern is concentrated among financially constrained firms or among firms with short-horizon investors. The positive effect of business education among overvalued firms appears only in firms with short-horizon investors, regardless of financial constraint status. The results are more consistent with an interpretation in which investor horizon shapes the R&D response of business-educated CEOs under overvaluation, rather than one in which favorable equity financing opportunities are the primary driver. Taken together, these findings are difficult to reconcile with a pure equity-financing explanation and are more consistent with a catering-based interpretation.
This study makes two main contributions. It shifts the analysis of CEO educational background from an average-effect perspective to a conditional-effect perspective. CEO business education does not have a uniform implication for R&D investment across valuation environments. Its effect depends on whether firms are overvalued. This finding helps explain why the same managerial background can lead to different investment choices under different market conditions. The study also adds a managerial-heterogeneity perspective to the misvaluation-investment literature by showing that valuation signals are filtered through CEO characteristics. Stock overvaluation does not translate into R&D investment in a uniform way. Its effect on R&D investment depends partly on the characteristics of the CEO who interprets valuation signals and converts them into investment decisions.
The remainder of this paper is organized as follows. Section 2 reviews the related literature and develops the testable hypotheses. Section 3 describes the data, variables, and research design. Section 4 presents the empirical results. Section 5 concludes with implications, limitations, and directions for future research.
Ⅱ. Literature Review and Testable Hypotheses
2.1 CEO Business Educational Background and R&D Investment
Upper echelons theory views corporate outcomes as reflecting the individuals who make decisions. Firm policies depend on how CEOs interpret the environment they face (Hambrick, 2007; Hambrick and Mason, 1984). CEOs do not simply react to external information. They interpret signals from their own perspectives and act accordingly. This explains why firms facing similar conditions may adopt different policies (Adner and Helfat, 2003; Bertrand and Schoar, 2003; Driouchi et al., 2022). This perspective is particularly relevant for corporate R&D investment. R&D is among the most uncertain forms of corporate investment. It requires substantial upfront commitments and produces outcomes that are difficult to verify ex ante (Czarnitzki and Toole, 2011; Hottenrott et al., 2016). These features make R&D decisions highly dependent on managerial judgment (Custódio and Metzger, 2014; Malmendier and Tate, 2005). As a result, CEO characteristics can lead to systematic differences in R&D investment behavior. Firms differ not only in how much they invest, but also in how they finance those investments (Benmelech and Frydman, 2015; Custódio et al., 2019; Graham et al., 2013). The CEO does not merely implement a predetermined policy. The CEO shapes how the firm responds to external conditions.
Among observable CEO traits, educational background is particularly relevant because it reflects how managers are trained to process information, evaluate risk, and make resource-allocation decisions (Barker and Mueller, 2002; Darmadi, 2013; Gottesman and Morey, 2006; Gounopoulos et al., 2021; Kallias et al., 2023). A business-related educational background may support R&D investment for several reasons. First, business education can strengthen managers’ ability to evaluate investment opportunities and allocate capital across competing uses. Such capabilities are particularly relevant for R&D because the expected returns from R&D projects are difficult to assess ex ante and often materialize only over long horizons. CEOs with stronger training in valuation and capital allocation may therefore be better equipped to distinguish promising R&D projects from less attractive ones and to commit resources despite uncertainty (Dong et al., 2025; Graham et al., 2013).
Second, business education may facilitate the financing of R&D investment. R&D projects typically require sustained resource commitments before their economic benefits become observable, making access to and management of financial resources particularly important. Prior studies suggest that CEO educational background is related to firms’ financing capacity and investment decisions (Gounopoulos et al., 2021; Gupta, 2022; Gupta et al., 2021). If business-educated CEOs are better able to secure external capital and manage internal financial resources, they may be more willing and able to undertake R&D projects that would otherwise be difficult to finance. Korean evidence also suggests that CEO educational characteristics are associated with firms’ R&D investment behavior (Ha and Lee, 2014). Taken together, these arguments provide a theoretical basis for a positive relation between CEO business educational background and R&D investment: business education may equip CEOs with the evaluation, resource-allocation, and financing capabilities needed to undertake uncertain, long-horizon R&D projects.
However, a business-related educational background may discourage R&D investment. Greater emphasis on measurable performance and short-term outcomes can reduce willingness to commit resources to projects with uncertain and delayed returns (Christensen et al., 2007; Miller and Xu, 2019). Because R&D outcomes are difficult to evaluate and may generate short-term earnings pressure, business-trained CEOs may prefer investments with clearer and more immediate financial payoffs (Kim, 2025). Consistent with this view, Loukil and Yousfi (2022) find that CEOs with business degrees are less likely to engage in innovative activities.
Taken together, prior studies point to an ambiguous relation between business-related educational backgrounds and R&D investment. CEO business education may improve capital allocation and access to financing, yet it may also increase reluctance to invest in uncertain long-horizon projects.
2.2 Stock Overvaluation and R&D Investment
Prior research shows that stock overvaluation can influence real corporate decisions, particularly when firms rely on external financing or when managers have incentives to respond to firm valuations (Morck et al., 1990). One prominent explanation is the equity-financing channel. Overvaluation lowers the effective cost of external capital and allows firms to issue equity on favorable terms. This can enable firms to invest beyond what their internal resources would otherwise permit. Stein (1996) argues that stock prices can affect investment when financing frictions are present. Related studies show that investment becomes more sensitive to stock prices among equity-dependent firms and during periods of favorable financing conditions (Baker et al., 2003; McLean and Zhao, 2014; Warusawitharana and Whited, 2016).
A second explanation emphasizes catering incentives. Elevated valuations may give managers stronger incentives to justify optimistic market expectations and sustain high stock prices. Managers may therefore adjust corporate policies in ways that investors view favorably, even when such actions are not fully supported by fundamentals. Jensen (2005) argues that managers may overinvest during high-valuation periods. Polk and Sapienza (2009) show that stock overvaluation can induce overinvestment when managers respond to stock prices. Other studies document that firms are more likely to undertake valuation-sensitive actions during periods of overvaluation (Baker and Wurgler, 2004; Gao, 2010; Jin, 2022).1)
These mechanisms are also relevant to R&D investment. Easier access to external capital may support R&D projects that would otherwise be delayed or underfunded (Dang and Xu, 2018; Li, 2026). At the same time, R&D can serve as a visible signal of future growth (Platikanova, 2026). Managers may increase R&D spending when such investment is likely to be viewed as consistent with optimistic market expectations (Dong et al., 2021; Duong, 2024; Shen et al., 2021). Taken together, prior studies suggest that stock overvaluation affects both the opportunity to invest and the incentive to do so. The net effect on R&D investment depends on how managers interpret valuation conditions and translate them into investment decisions.
2.3 Testable Hypotheses
The preceding discussion suggests that both CEO business educational background and stock overvaluation shape R&D investment decisions. CEO business educational background influences how managers evaluate investment opportunities, manage financing, and respond to capital market conditions. Stock overvaluation, in turn, changes both the resources available for investment and the incentives that guide managerial behavior. These forces jointly determine how firms adjust R&D investment.
The first possibility is that CEO business education is positively associated with R&D investment. As discussed above, business-educated CEOs may be better equipped to evaluate uncertain investment opportunities, allocate financial resources, and obtain financing for long-horizon projects. These capabilities can make R&D investment more feasible and attractive despite its uncertain and delayed payoffs. Under this view, business-educated CEOs are more willing and able to commit resources to R&D even in the absence of stock overvaluation.
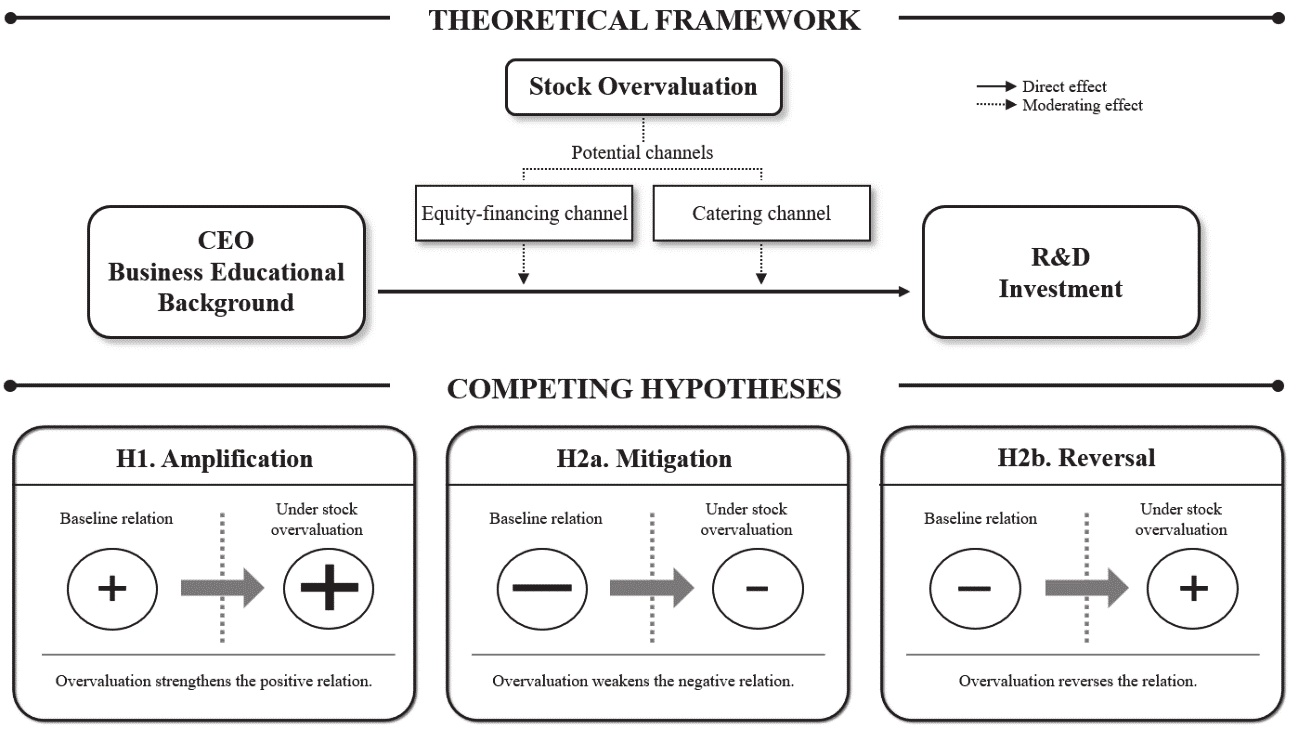
Stock overvaluation may reinforce business-educated CEOs’ tendency to invest in R&D. One channel operates through financing conditions. When firms are overvalued, access to external equity becomes less costly and financing opportunities expand (Baker et al., 2003; McLean and Zhao, 2014). Business-educated CEOs, who are trained in valuation and capital allocation, may be more likely to recognize these opportunities and channel additional resources into R&D investment. A second channel reflects market responsiveness. Greater attention to capital markets may lead business-educated CEOs to align investment decisions with market expectations (Sun et al., 2021). This channel can further strengthen their tendency to increase R&D investment. Taken together, these arguments suggest that stock overvaluation amplifies the positive relation between CEO business educational background and R&D investment.
Hypothesis 1 (Amplification). Stock overvaluation strengthens the positive relation between CEO business educational background and R&D investment.
Stock overvaluation may also weaken the conservative tendency toward R&D investment associated with CEO business educational background. Under normal conditions, business-educated CEOs may be reluctant to invest in R&D because such investment requires large upfront commitments and is difficult to evaluate ex ante (Czarnitzki and Toole, 2011; Hottenrott et al., 2016). These concerns are likely to be more salient for CEOs who emphasize financial discipline and short-term accountability (Kim, 2025; Miller and Xu, 2019). Overvaluation can partially reduce this reluctance through two channels. First, by lowering the effective cost of external equity, overvaluation weakens one financial reason for avoiding R&D (Baker et al., 2003; McLean and Zhao, 2014; Warusawitharana and Whited, 2016). Second, because R&D can serve as a visible signal of future growth, an excessively conservative R&D policy may become less consistent with valuation-related market expectations when firms are overvalued (Dong et al., 2021; Duong, 2024; Shen et al., 2021). Thus, even if business-educated CEOs remain less inclined to invest in R&D, the negative association between CEO business educational background and R&D investment should be weaker under overvaluation.
Hypothesis 2a (Mitigation). Stock overvaluation weakens the negative relationship between CEO business educational background and R&D investment.
This mitigation effect can take a stronger form. Here, the relevant question is not whether overvaluation strengthens an already positive relation, but whether it is strong enough to overturn an initially negative relation. Under this scenario, overvaluation does not merely reduce business-educated CEOs’ reluctance toward R&D. It changes the direction of their R&D response. Favorable financing conditions make R&D less costly to undertake, while valuation-related incentives increase the payoff to visible investment in future growth. Prior studies suggest that overvalued firms face incentives to justify optimistic market expectations and sustain high valuations through corporate policies that investors view favorably (Gao, 2010; Jensen, 2005; Jin, 2022; Polk and Sapienza, 2009). When these forces dominate the baseline conservative tendency, business-educated CEOs may move from reduced reluctance to active R&D investment. Accordingly, stock overvaluation may reverse the negative relation between CEO business educational background and R&D investment.
Hypothesis 2b (Reversal). Stock overvaluation reverses the negative relationship between CEO business educational background and R&D investment, such that business-educated CEOs exhibit higher R&D investment than non-business CEOs among overvalued firms.
Figure 1 summarizes the theoretical framework and the three competing hypotheses developed above. The upper panel illustrates how stock overvaluation may modify the relation between CEO business educational background and R&D investment through the potential equity-financing and catering channels, while the lower panel summarizes the amplification, mitigation, and reversal hypotheses.
Ⅲ. Data and Research Design
3.1 Sample and Data
This study uses a sample of Korean listed firms from 2011 to 2023. The sample period begins in 2011, when Korean listed firms adopted Korean International Financial Reporting Standards, which enhances the comparability of financial statements across firms. The sample ends in 2023 based on the availability of financial and firm-level data. Financial firms (two-digit Korean Standard Industrial Classification (KSIC) codes 64–66) are excluded because their accounting structures and regulatory environments differ substantially from those of non-financial firms.
Information on firms’ R&D investment, stock prices, and financial statement variables is obtained from DataGuide 6. Information on CEO educational background is hand-collected from firms’ annual reports filed with the Financial Supervisory Service and supplemented with data from the TS-2000 database provided by the Korea Listed Companies Association. When information on CEO educational background is not available from these sources, we further supplement it through searches on major online portals, including Naver, Daum, and Google. Observations with missing values for variables are removed. The final sample consists of 2,397 unique firms and 21,618 firm-year observations.
3.2 Variables
3.2.1 R&D Investment
R&D investment is proxied by R&D intensity (RDI), which is defined as total R&D expenditure scaled by total sales. Total R&D expenditure includes both R&D expenses recognized in the income statement and R&D expenditures capitalized as intangible assets.
3.2.2 CEO Business Educational Background
We construct our measure of CEO business educational background in two steps. First, we identify the CEO for each firm-year. In this study, the CEO is defined as the individual designated as the representative director in the annual report (e.g., Ryu and Kim, 2020; Yim, 2019). When multiple representative directors are reported (i.e., co-CEO structures), the CEO is identified as the individual whose signature appears first in the report (Yim and Kang, 2024). In the Korean institutional setting, the first signature on the annual report is generally understood to indicate ultimate responsibility for the disclosed information. Using this procedure, we identify 4,975 unique CEOs over the sample period.
Second, we manually collect detailed information on the educational backgrounds of the identified CEOs, including the level and field of each reported degree. Degree levels are classified as bachelor’s, master’s, and doctoral degrees. We classify CEOs as having a business educational background if at least one bachelor’s, master’s, or doctoral degree in a business-related field is identified in the CEO’s available educational records (e.g., Mun and Kim, 2021). Business-related fields include business administration, management, finance, accounting, and closely related disciplines. MBA degrees are classified as master’s-level business education; this classification indicates that an MBA represents formal business education undertaken at the master’s level and does not assume that an MBA is equivalent to an academic master’s degree. Accordingly, BUSINESS is defined as an indicator variable equal to one if the CEO holds at least one degree in a business-related field, and zero otherwise. This classification captures whether the CEO has received formal business education at any stage of higher education, rather than assigning the CEO to an educational category based solely on the field of the highest reported degree.
3.2.3 Stock Overvaluation
We measure stock overvaluation using the firm-specific misvaluation component based on the decomposition method of Rhodes-Kropf et al. (2005). This approach decomposes the market-to-book ratio into firm-specific, industry-specific, and long-term components. We focus on the firm-specific component (e.g., Alzahrani and Rao, 2014; Jin, 2022; Mrad et al., 2024), which captures deviations between market value and accounting-based fundamentals that are unique to each firm.
To implement this approach, we estimate cross-sectional regressions of market value on accounting fundamentals within each industry-year:2)
where $i$, $j$, and $t$ denote firm, industry, and year, respectively. $m_{i,t}$ is the logarithm of the market value of equity, $b_{i,t}$ is the logarithm of the book value of equity, $\mathit{NI}^{+}_{i,t}$ denotes the absolute value of net income, $I\left(\mathit{NI}_{i,t} < 0\right)$ is an indicator for negative earnings, and $\mathit{LEV}_{i,t}$ denotes leverage. Using the estimated coefficients, we obtain the predicted log market value implied by firm fundamentals. Firm-specific misvaluation is calculated as the difference between the observed log market value and the predicted log market value.
To construct a measure of overvaluation, we classify firm-year observations into terciles based on the annual distribution of firm-specific misvaluation (e.g., Bonaimé et al., 2014; Mrad et al., 2024). Firms in the highest tercile are defined as overvalued. Based on this classification, we construct an indicator variable, OVER, equal to one if a firm-year observation falls into the highest tercile and zero otherwise.
3.2.4 Control Variables
This study includes CEO age (CEOAGE) and CEO ownership (CEOOWN) to control for other observable CEO characteristics that may be associated with both CEO educational background and R&D investment decisions (e.g., Mun and Kim, 2021). We then control for a set of firm characteristics that may affect R&D investment. Firm size (FIRMSIZE) accounts for the greater resource availability of larger firms, while firm age (FIRMAGE) captures organizational maturity that may influence innovation behavior. We include return on assets (ROA) to reflect internal funding capacity that can support R&D investment. Leverage (LEV) reflects financial risk and may constrain discretionary investment. Asset tangibility (TANG) captures differences in asset structure that may affect financing conditions for R&D activities. Cash holdings (CASH) are included to capture internal liquidity and financial flexibility that may support R&D investment. Capital expenditure (CAPEX) is included to control for firms’ general investment activity, allowing us to distinguish R&D investment from broader capital investment decisions. Sales growth (GROWTH) captures firms’ growth opportunities and expansion prospects.3) Finally, we control for ownership structure by including foreign ownership (FOR) and large shareholdings (LARGE), as these factors may influence monitoring intensity and managerial decision-making. Variable definitions are provided in Table A1 in the Appendix.
3.3 Research Design
We estimate the following baseline regression model:
RDI denotes R&D investment, BUSINESS is an indicator variable for CEO business educational background, and OVER denotes stock overvaluation. X represents a vector of control variables. We include firm and year fixed effects ($\mu_{i}$ and $\lambda_{t}$) to control for time-invariant firm characteristics and time trends. $\varepsilon_{i,t+1}$ is the error term. Standard errors are clustered at the firm level.
The coefficient of interest is β3, which captures how stock overvaluation modifies the relation between CEO business educational background and R&D investment. Specifically, β3 reflects the difference in the effect of BUSINESS between overvalued firms (OVER = 1) and non-overvalued firms (OVER = 0). The conditional effect of BUSINESS on RDI is given by β1 when OVER = 0, and by β1 + β3 when OVER = 1. Thus, β3 represents how the effect of CEO business educational background changes when firms are overvalued.
The interpretation of β3 depends on both the sign of β1 and the conditional effect of CEO business educational background among overvalued firms, β1 + β3. Under Hypothesis 1 (Amplification), stock overvaluation strengthens the positive relation between CEO business educational background and R&D investment. This pattern requires both β1 and β3 to be positive. Under Hypothesis 2a (Mitigation), stock overvaluation attenuates, but does not reverse, the negative relation between CEO business educational background and R&D investment. This pattern requires a negative β1, a positive β3, and a non-positive β1 + β3. Hypothesis 2b (Reversal) represents a stronger case in which stock overvaluation reverses the negative relation, such that business-educated CEOs increase R&D investment when firms are overvalued. This pattern requires a negative β1, a positive β3, and a positive β1 + β3.
Table 1 summarizes how the estimated coefficients correspond to the testable hypotheses. All three hypotheses can involve a positive interaction coefficient, but they differ in the baseline relation between CEO business educational background and R&D investment and in the conditional relation among overvalued firms. Thus, the empirical separation between Hypothesis 2a and Hypothesis 2b requires testing whether β1 + β3 is statistically greater than zero.
<Table 1> Testable hypotheses and expected coefficient patterns
| Hypotheses | Effect of CEOs’ business educational background | Expected coefficient pattern | |
|---|---|---|---|
| Non-overvalued firms | Overvalued firms | ||
| Amplification | Positive | More positive | β1 > 0, β3 > 0 |
| Mitigation | Negative | Less negative | β1 < 0, β3 > 0, β1 + β3 ≤ 0 |
| Reversal | Negative | Positive | β1 < 0, β3 > 0, β1 + β3 > 0 |
3.4 Summary Statistics
Table 2 presents the distribution of CEO business education and the descriptive statistics for the variables used in the main analysis. Panel A shows that, among the 4,975 CEOs identified in our sample, 2,178 have at least one business-related degree. Of these CEOs, 1,590 hold a business-related bachelor’s degree, 1,685 hold a business-related master’s degree, and 29 hold a business-related doctoral degree. These degree-level categories are not mutually exclusive because a CEO may hold business-related degrees at more than one level.
<Table 2> Distribution of CEO business education and descriptive statistics
Panel A reports the distribution of CEOs with business educational backgrounds by degree level. The degree-level categories are not mutually exclusive because a CEO may hold business-related degrees at multiple levels. Degree-level counts are based on degrees identified in the available educational records and do not imply that an unreported degree was not obtained. Panel B reports summary statistics for the variables used in the baseline regressions. All continuous variables are winsorized at the 1st and 99th percentiles. Variable definitions are provided in Table A1.
| Panel A. Distribution of CEO business education | |||||
|---|---|---|---|---|---|
| Business education | No. of CEOs | ||||
| All CEOs | 4,975 | ||||
| Business-educated CEOs | 2,178 | ||||
| Business-related bachelor’s degree | 1,590 | ||||
| Business-related master’s degree | 1,685 | ||||
| Business-related doctoral degree | 29 | ||||
| Panel B. Descriptive statistics | |||||
| Variables | Mean | Std. Dev. | Min | Median | Max |
| RDI | 0.033 | 0.079 | 0.000 | 0.010 | 0.374 |
| BUSINESS | 0.443 | 0.497 | 0.000 | 0.000 | 1.000 |
| OVER | 0.333 | 0.471 | 0.000 | 0.000 | 1.000 |
| CEOAGE | 4.020 | 0.142 | 3.638 | 4.043 | 4.317 |
| CEOOWN | 0.125 | 0.138 | 0.000 | 0.053 | 0.545 |
| FIRMSIZE | 26.117 | 1.476 | 23.474 | 25.845 | 31.080 |
| FIRMAGE | 3.241 | 0.614 | 1.386 | 3.219 | 4.344 |
| ROA | 0.025 | 0.085 | −0.315 | 0.032 | 0.228 |
| LEV | 0.420 | 0.204 | 0.054 | 0.416 | 0.887 |
| TANG | 0.293 | 0.185 | 0.004 | 0.283 | 0.747 |
| CASH | 0.110 | 0.101 | 0.002 | 0.080 | 0.527 |
| CAPEX | 0.042 | 0.049 | 0.000 | 0.025 | 0.254 |
| GROWTH | 0.120 | 0.448 | −0.641 | 0.049 | 1.903 |
| FOR | 0.063 | 0.098 | 0.000 | 0.022 | 0.517 |
| LARGE | 0.398 | 0.166 | 0.007 | 0.391 | 0.790 |
Panel B presents the summary statistics for the variables used in the main analysis. The mean value of RDI is 0.033, indicating that, on average, R&D expenditure accounts for 3.3% of total sales. The mean value of BUSINESS is 0.443, indicating that 44.3% of firm-year observations are led by CEOs with business educational backgrounds. The mean value of OVER is 0.333, which is consistent with the classification of overvalued firms based on the top tercile of firm-specific misvaluation.4) The average of the natural logarithm of CEO age (CEOAGE) is 4.020, and the average CEO ownership (CEOOWN) is 2.5%. Regarding firm characteristics, the mean values of FIRMSIZE and FIRMAGE, both measured in natural logarithms, are 26.117 and 3.241, respectively. The mean values of return on assets (ROA), leverage (LEV), cash holdings (CASH), capital expenditure (CAPEX), and sales growth (GROWTH) are 0.025, 0.420, 0.110, 0.042, and 0.120, respectively. The average foreign ownership (FOR) is 6.3%, while the average ownership by large shareholders (LARGE) is 39.8%.5)
Ⅳ. Empirical Results
4.1 Baseline Regressions
Table 3 reports the baseline regression results. In the regression analyses, RDI is multiplied by 100 for ease of interpretation. Column (1) includes only the main variables, column (2) adds CEO characteristics (CEO age (CEOAGE) and CEO ownership (CEOOWN)), and column (3) includes the full set of control variables. Across all specifications, the coefficient on BUSINESS is negative and statistically significant.
<Table 3> Baseline regressions
This table reports the baseline regression results. Definitions of the remaining variables are provided in Table A1. Values in parentheses are t-statistics based on standard errors clustered at the firm level. The row “β1 + β3” reports the estimated sum of the coefficients on BUSINESS and BUSINESS × OVER. The value in parentheses for this row is the t-statistic from testing the null hypothesis that β1 + β3 = 0. *, **, and *** indicate statistical significance at the 10%, 5%, and 1% levels, respectively.
| Dependent variable = RDIt+1 (%) | ||||
|---|---|---|---|---|
| (1) | (2) | (3) | ||
| BUSINESS | β1 | −0.625*** | −0.557*** | −0.469** |
| (−4.30) | (−3.80) | (−2.33) | ||
| OVER | β2 | 2.693*** | 1.303*** | 0.987*** |
| (8.45) | (5.25) | (4.53) | ||
| BUSINESS × OVER | β3 | 1.376*** | 0.913*** | 0.775*** |
| (5.42) | (3.59) | (3.15) | ||
| CEOAGE | γ1 | −0.428* | −0.430* | |
| (−1.70) | (−1.92) | |||
| CEOOWN | γ2 | 0.210** | 0.208** | |
| (2.30) | (2.17) | |||
| FIRMSIZE | γ3 | 0.555*** | ||
| (7.21) | ||||
| FIRMAGE | γ4 | −1.277*** | ||
| (−7.60) | ||||
| ROA | γ5 | 9.144*** | ||
| (9.80) | ||||
| LEV | γ6 | −5.811*** | ||
| (−5.21) | ||||
| TANG | γ7 | 0.980 | ||
| (1.19) | ||||
| CASH | γ8 | 2.233* | ||
| (1.70) | ||||
| CAPEX | γ9 | −5.203*** | ||
| (−3.63) | ||||
| GROWTH | γ10 | 0.735*** | ||
| (3.51) | ||||
| FOR | γ11 | 1.533 | ||
| (1.33) | ||||
| LARGE | γ12 | −4.055*** | ||
| (−7.16) | ||||
| Constant | α | −1.243*** | −0.411*** | −0.344*** |
| (−5.23) | (−3.46) | (−2.76) | ||
| Firm FE | Yes | Yes | Yes | |
| Year FE | Yes | Yes | Yes | |
| Observations | 21,618 | 21,618 | 21,618 | |
| Within R2 | 0.085 | 0.130 | 0.254 | |
| β1 + β3 | 0.751*** | 0.356*** | 0.306** | |
| (t-statistics) | (4.40) | (2.59) | (2.50) | |
In column (3), the coefficient on BUSINESS is −0.469 and significant at the 5% level, indicating that business-educated CEOs are associated with R&D intensity that is 0.469 percentage points lower among non-overvalued firms. This finding is consistent with the view that business-educated CEOs may be more cautious about R&D investment (Miller and Xu, 2019), especially when firms are not overvalued and R&D involves uncertain outcomes and short-term performance pressure. The coefficient on BUSINESS × OVER is 0.775 and significant at the 1% level. This estimate indicates that the association between CEO business educational background and R&D intensity is 0.775 percentage points higher among overvalued firms than among non-overvalued firms.
To assess the effect of CEO business educational background among overvalued firms, we report the linear combination (β1 + β3) of the coefficients on BUSINESS and BUSINESS × OVER at the bottom of the table. The linear combination is positive and statistically significant in all specifications. In Column (3), the linear combination is 0.306 and significant at the 5% level. This finding indicates that, among overvalued firms, business-educated CEOs are associated with a 0.310 percentage point higher R&D intensity than non-business CEOs. Thus, the negative relation between CEO business educational background and R&D investment is not merely attenuated under overvaluation. It becomes positive.6)
Taken together, the baseline results support Hypothesis 2b. Business-educated CEOs are associated with lower R&D investment when firms are not overvalued, but the association becomes positive among overvalued firms.
4.2 Endogeneity
4.2.1 R&D Persistence and Reverse Causality
Although the baseline results are consistent with the reversal hypothesis, several endogeneity concerns may affect the interpretation of the findings. The first concern relates to the persistence of R&D investment and potential reverse causality. R&D investment is likely to be persistent because firms’ current R&D decisions depend on accumulated technological capabilities and prior investment commitments (e.g., Yim and Kang, 2024). If firms’ prior R&D trajectories are correlated with CEO educational background or valuation conditions, the baseline estimates may partly reflect persistent R&D patterns rather than the effect of CEO business education under overvaluation. In addition, firms with high levels of past R&D investment may receive higher market valuations (Li, 2026), raising concerns that stock overvaluation reflects market expectations about future R&D.
To mitigate this concern, we estimate a dynamic panel model using the two-step system generalized method of moments (GMM) estimator (Arellano and Bover, 1995; Roodman, 2009). We include the lagged dependent variable as an additional regressor to account for the persistence of R&D investment. By using internal instruments based on lagged values of the variables, system GMM helps mitigate biases arising from unobserved firm-specific effects, the inclusion of the lagged dependent variable, and the potential endogeneity of BUSINESS and BUSINESS × OVER. This approach allows us to test whether the baseline reversal pattern remains robust in a dynamic panel setting.7)
Table 4 reports the results. The diagnostic tests support the validity of the system GMM specification. The AR (1) test is significant, while the AR (2) test is insignificant, indicating no evidence of second-order serial correlation. The Hansen J test is also insignificant, suggesting no evidence against the validity of the instruments. The coefficient on RDI is positive and statistically significant, confirming the persistence of R&D investment. More importantly, the coefficient on BUSINESS remains negative, whereas the coefficient on BUSINESS × OVER remains positive and statistically significant. The linear combination of the coefficients on BUSINESS and BUSINESS × OVER is also positive and statistically significant, indicating that business-educated CEOs are associated with higher R&D investment than non-business CEOs among overvalued firms. These results suggest that the reversal pattern documented in the baseline regressions persists after accounting for R&D persistence and addressing concerns about potential reverse causality.
<Table 4> Endogeneity checks (1) system GMM
This table reports the system GMM estimation results. Definitions of the remaining variables are provided in Table A1. Values in parentheses are t-statistics based on Windmeijer-corrected robust standard errors with finite-sample adjustment. The row “β1 + β3” reports the estimated sum of the coefficients on BUSINESS and BUSINESS × OVER. The value in parentheses for this row is the t-statistic from testing the null hypothesis that β1 + β3 = 0. *, **, and *** indicate statistical significance at the 10%, 5%, and 1% levels, respectively.
| Dependent variable = RDIt+1 (%) | ||
|---|---|---|
| RDI | ρ | 0.317*** |
| (8.20) | ||
| BUSINESS | β1 | −0.877* |
| (−1.93) | ||
| OVER | β2 | 3.163*** |
| (3.99) | ||
| BUSINESS × OVER | β3 | 2.175** |
| (2.50) | ||
| CEOAGE | γ1 | −0.530** |
| (−2.00) | ||
| CEOOWN | γ2 | 0.157* |
| (1.90) | ||
| FIRMSIZE | γ3 | 0.150*** |
| (4.34) | ||
| FIRMAGE | γ4 | −0.495* |
| (−1.89) | ||
| ROA | γ5 | 4.880*** |
| (2.90) | ||
| LEV | γ6 | −2.745*** |
| (−5.41) | ||
| TANG | γ7 | 0.051 |
| (0.05) | ||
| CASH | γ8 | 1.977** |
| (2.24) | ||
| CAPEX | γ9 | −2.290** |
| (−2.42) | ||
| GROWTH | γ10 | 0.341** |
| (2.40) | ||
| FOR | γ11 | 0.850 |
| (1.13) | ||
| LARGE | γ12 | −2.873*** |
| (−4.91) | ||
| Constant | α | 1.422 |
| (0.89) | ||
| Year FE | Yes | |
| Observations | 21,618 | |
| Diagnostic test | ||
| AR(1) test (p-value) | 0.000 | |
| AR(2) test (p-value) | 0.275 | |
| Hansen J test (p-value) | 0.539 | |
| β1 + β3 | 1.298** | |
| (t-statistics) | (2.10) | |
4.2.2 Endogenous CEO Appointments
The second concern relates to the endogenous appointment of CEOs with business educational backgrounds. Firms with different innovation environments may appoint CEOs with different educational backgrounds. For instance, He and Hirshleifer (2022) note that CEOs with Ph.D. degrees are concentrated in innovative industries, suggesting that CEO educational background may be systematically related to firms’ innovation environments. If unobserved firm characteristics affect both the appointment of business-educated CEOs and subsequent R&D investment, the estimated relation between CEO business educational background and R&D investment may be biased.
To address this concern, we employ an instrumental variable (IV) approach. Following the intuition of Mun and Kim (2021), we use the industry-level proportion of business-educated CEOs (BUS_IND), excluding the focal firm, as an IV for CEO business educational background. Industries are defined based on two-digit KSIC codes. The relevance of this instrument rests on the idea that firms are more likely to appoint business-educated CEOs when such CEOs are more prevalent in the same industry. This industry-level prevalence reflects the managerial labor market and CEO appointment patterns within the industry (Kallias et al., 2023). The exclusion restriction rests on the assumption that, conditional on firm characteristics, firm fixed effects, and year fixed effects, the industry-level prevalence of business-educated CEOs affects subsequent R&D investment mainly through the appointment of a business-educated CEO (Mun and Kim, 2021).
Because CEO business educational background enters the model both directly and through its interaction with stock overvaluation, we treat both BUSINESS and BUSINESS × OVER as endogenous regressors. BUSINESS is instrumented by BUS_IND, and BUSINESS × OVER is instrumented by the interaction between BUS_IND and OVER. This approach follows the standard IV principle that when an endogenous variable is interacted with an observed conditioning variable, the interaction term should also be instrumented (e.g., Balli and Sørensen, 2013; Bun and Harrison, 2019).8)
Table 5 reports the IV estimation results. Columns (1) and (2) present the first-stage regressions for BUSINESS and BUSINESS × OVER, respectively, and column (3) presents the second-stage results. The first-stage results show that BUS_IND is positively and significantly associated with BUSINESS, and BUS_IND × OVER is positively and significantly associated with BUSINESS × OVER. The Sanderson-Windmeijer F statistics are 21.86 and 24.13 for the two endogenous regressors, respectively, and the Kleibergen-Paap rk F statistic is 19.31. These statistics suggest that weak instrument concerns are unlikely to drive the results.9)
<Table 5> Endogeneity checks (2) IV estimation for endogenous CEO appointment
This table reports the instrumental variable estimation results. Columns (1) and (2) report the first-stage regressions for BUSINESS and BUSINESS × OVER, respectively. Column (3) reports the second-stage regression results. BUSINESS is instrumented by BUS_IND, and BUSINESS × OVER is instrumented by BUS_IND × OVER. Definitions of the remaining variables are provided in Table A1. Values in parentheses are t-statistics for the first-stage regressions and z-statistics for the second-stage regression, based on robust standard errors. The row “β1 + β3” reports the estimated sum of the coefficients on BUSINESS and BUSINESS × OVER. The value in parentheses for this row is the z-statistic from testing the null hypothesis that β1 + β3 = 0. *, **, and *** indicate statistical significance at the 10%, 5%, and 1% levels, respectively.
| First stage | Second stage | |||
|---|---|---|---|---|
| (1) | (2) | (3) | ||
| BUSINESS | BUSINESS × OVER | RDIt+1 (%) | ||
| BUS_IND | 0.800*** | 0.240* | ||
| (12.76) | (1.88) | |||
| BUS_IND × OVER | 0.155*** | 0.209*** | ||
| (3.35) | (5.27) | |||
| BUSINESS (instrumented) | β1 | −0.293* | ||
| (−1.91) | ||||
| OVER | β2 | 1.205*** | ||
| (4.11) | ||||
| BUSINESS × OVER (instrumented) | β3 | 0.689** | ||
| (2.40) | ||||
| CEOAGE | γ1 | −0.044*** | 0.001 | −0.325*** |
| (−2.92) | (0.50) | (−2.60) | ||
| CEOOWN | γ2 | 0.080** | 0.040 | 0.027 |
| (1.98) | (0.75) | (1.40) | ||
| FIRMSIZE | γ3 | 0.007*** | 0.010*** | 0.411*** |
| (3.92) | (2.89) | (4.19) | ||
| FIRMAGE | γ4 | 0.097*** | 0.018*** | −0.227** |
| (8.99) | (2.95) | (−2.15) | ||
| ROA | γ5 | 0.162*** | 0.187*** | 1.677*** |
| (3.21) | (2.69) | (3.81) | ||
| LEV | γ6 | −0.055 | −0.010 | −5.550*** |
| (−0.70) | (−1.03) | (−8.04) | ||
| TANG | γ7 | 0.211*** | 0.098*** | 0.711 |
| (2.99) | (4.22) | (0.22) | ||
| CASH | γ8 | 0.150*** | −0.020 | 2.097 |
| (4.50) | (−0.90) | (0.49) | ||
| CAPEX | γ9 | 0.197*** | −0.035 | −4.318** |
| (3.15) | (−0.73) | (−2.10) | ||
| GROWTH | γ10 | −0.011** | −0.003* | 1.205* |
| (−2.10) | (−1.80) | (1.74) | ||
| FOR | γ11 | 0.049*** | 0.044 | 1.762 |
| (2.99) | (1.12) | (0.39) | ||
| LARGE | γ12 | 0.111*** | −0.015 | −1.097*** |
| (7.15) | (−0.70) | (−3.28) | ||
| Firm FE | Yes | Yes | Yes | |
| Year FE | Yes | Yes | Yes | |
| Observations | 21,618 | 21,618 | 21,618 | |
| Diagnostic test | ||||
| Sanderson-Windmeijer F statistic | 21.86*** | 24.13*** | ||
| Kleibergen-Paap rk F statistic | 19.31*** | |||
| β1 + β3 | 0.396** | |||
| (z-statistics) | (2.49) | |||
The second-stage results are consistent with the baseline findings. The coefficient on BUSINESS is negative and statistically significant, while the coefficient on BUSINESS × OVER is positive and statistically significant. More importantly, the linear combination of the coefficients on BUSINESS and BUSINESS × OVER is positive and statistically significant. These results indicate that, even after addressing concerns about endogenous CEO appointment, business-educated CEOs are associated with higher R&D investment than non-business CEOs among overvalued firms. Thus, the IV results continue to support the reversal hypothesis.
4.2.3 Observable Selection Bias
The third concern relates to observable selection bias. Firms led by business-educated CEOs may differ from firms led by non-business CEOs in observable characteristics (Dong et al., 2025). Similarly, overvalued firms may differ from non-overvalued firms in financial conditions or investment capacity (Mrad et al., 2024; Yim, 2025). These differences may affect subsequent R&D investment independently of CEO educational background or valuation status. If firms with certain observable characteristics are more likely to appoint business-educated CEOs or to be classified as overvalued, the estimated interaction effect may partly reflect differences in firm composition rather than the effect of CEO business educational background among overvalued firms.
To address this concern, we employ propensity score matching (PSM) to construct more comparable samples. We conduct two separate matching procedures. First, the treatment group consists of firm-year observations led by CEOs with business educational backgrounds (BUSINESS = 1), and the control group consists of firm-year observations led by CEOs without such backgrounds (BUSINESS = 0). We refer to this sample as the business-matched sample. Second, the treatment group consists of overvalued firm-year observations (OVER = 1), and the control group consists of non-overvalued firm-year observations (OVER = 0). We refer to this sample as the overvaluation-matched sample. The propensity scores are estimated using the full set of control variables included in the baseline regression model. We perform one-to-one nearest-neighbor matching with replacement under a common-support restriction and then re-estimate the baseline model using each matched sample. Table A3 in the Appendix reports covariate balance tests, showing that the matching procedure substantially reduces observable differences between treated and control observations.
Table 6 reports the regression results using propensity score-matched samples. Column (1) presents the results based on the business-matched sample, and Column (2) presents the results based on the overvaluation-matched sample. In both columns, the coefficient on BUSINESS remains negative, whereas the coefficient on BUSINESS × OVER remains positive and statistically significant. The sum of the coefficients, β1 + β3, is positive and statistically significant. These findings indicate that the reversal pattern remains after reducing observable differences related to the two components of the interaction term, CEO business educational background and stock overvaluation status.10)
<Table 6> Endogeneity checks (3) propensity score matching
This table reports regression results using propensity score-matched samples. Column (1) reports the results based on the business-matched sample, where firms led by CEOs with business educational backgrounds are matched with firms led by CEOs without such backgrounds. Column (2) reports the results based on the overvaluation-matched sample, where overvalued firms are matched with non-overvalued firms. Definitions of the remaining variables are provided in Table A1. Values in parentheses are t-statistics based on standard errors clustered at the firm level. The row “β1 + β3” reports the estimated sum of the coefficients on BUSINESS and BUSINESS × OVER. The value in parentheses for this row is the t-statistic from testing the null hypothesis that β1 + β3 = 0. *, **, and *** indicate statistical significance at the 10%, 5%, and 1% levels, respectively.
| Dependent variable = RDIt+1 (%) | |||
|---|---|---|---|
| (1) | (2) | ||
| Business-matched sample | Overvaluation-matched sample | ||
| BUSINESS | β1 | −0.393** | −0.443** |
| (−2.30) | (−2.35) | ||
| OVER | β2 | 1.003*** | 0.920*** |
| (4.29) | (3.88) | ||
| BUSINESS × OVER | β3 | 0.758*** | 0.776*** |
| (3.15) | (3.20) | ||
| CEOAGE | γ1 | −0.390* | −0.463* |
| (−1.79) | (−1.91) | ||
| CEOOWN | γ2 | 0.230** | 0.225** |
| (2.43) | (2.20) | ||
| FIRMSIZE | γ3 | 0.680*** | 0.680*** |
| (6.79) | (6.30) | ||
| FIRMAGE | γ4 | −1.466*** | −0.953*** |
| (−7.50) | (−5.61) | ||
| ROA | γ5 | 8.940*** | 8.755*** |
| (8.90) | (8.30) | ||
| LEV | γ6 | −6.711*** | −7.081*** |
| (−7.90) | (−8.65) | ||
| TANG | γ7 | 0.133 | 0.176 |
| (0.59) | (1.30) | ||
| CASH | γ8 | 1.200 | 2.601** |
| (1.49) | (2.30) | ||
| CAPEX | γ9 | −4.977*** | −4.333** |
| (−3.03) | (−2.34) | ||
| GROWTH | γ10 | 0.780*** | 0.549** |
| (3.30) | (2.13) | ||
| FOR | γ11 | 1.160 | 1.313 |
| (0.97) | (1.52) | ||
| LARGE | γ12 | −4.433*** | −4.580*** |
| (−6.70) | (−6.46) | ||
| Constant | α | −0.423*** | −0.370* |
| (−2.99) | (−1.89) | ||
| Firm FE | Yes | Yes | |
| Year FE | Yes | Yes | |
| Observations | 19,120 | 14,370 | |
| Within R2 | 0.233 | 0.229 | |
| β1 + β3 | 0.365*** | 0.333** | |
| (t-statistics) | (2.80) | (2.17) | |
4.3 Robustness Checks
We conduct several robustness checks to examine whether the baseline reversal pattern is sensitive to alternative variable definitions, sample restrictions, and fixed-effect structures. Table 7 reports the results. Columns (1) and (2) examine whether the baseline results are sensitive to the measurement of R&D investment. In Column (1), we use RDA (%), measured as R&D expenditure scaled by lagged total assets and multiplied by 100. In Column (2), we use LnRD, measured as the natural logarithm of R&D expenditure. In both specifications, BUSINESS remains negative, BUSINESS × OVER remains positive and statistically significant, and the linear combination of the two coefficients remains positive and statistically significant. These results indicate that the reversal pattern is not driven by the choice of sales-scaled R&D intensity as the baseline dependent variable.
<Table 7> Robustness checks
This table reports robustness check results. The dependent variables in Columns (1) and (2) are RDA (%) and LnRD, respectively. In Columns (3) to (6), the dependent variable is RDI (%). Column (3) restricts the sample to firms with positive R&D expenditure. In Column (4), OVER is redefined as an indicator equal to one for firm-year observations in the highest quintile of firm-specific misvaluation (FSE). Column (5) replaces the indicator measure of overvaluation with the continuous FSE component derived from the Rhodes-Kropf et al. (2005) decomposition and includes its interaction with BUSINESS. Column (6) includes industry-by-year fixed effects. Definitions of the remaining variables are provided in Table A1. Values in parentheses are t-statistics based on standard errors clustered at the firm level. Within R2 is reported for Columns (1) to (5), and adjusted R2 is reported for Column (6). The row “β1 + β3” reports the estimated sum of the coefficients on BUSINESS and BUSINESS × OVER. The value in parentheses for this row is the t-statistic from testing the null hypothesis that β1 + β3 = 0. *, **, and *** indicate statistical significance at the 10%, 5%, and 1% levels, respectively.
| (1) RDA (%) | (2) LnRD | (3) Positive R&D sample only | (4) OVER based on top quintile of FSE | (5) Continuous FSE | (6) Industry × Year FE | ||
|---|---|---|---|---|---|---|---|
| BUSINESS | β1 | −0.361** | −0.060* | −0.477** | −0.379* | −0.404** | −0.125** |
| (−2.23) | (−1.79) | (−2.13) | (−1.83) | (−2.05) | (−2.11) | ||
| OVER | β2 | 0.835*** | 0.293*** | 1.225*** | 1.295*** | 0.997*** | |
| (5.43) | (4.67) | (6.37) | (6.50) | (3.69) | |||
| BUSINESS × OVER | β3 | 0.606*** | 0.121** | 0.655*** | 0.813*** | 0.414** | |
| (2.80) | (2.32) | (2.73) | (2.99) | (2.38) | |||
| FSE | β4 | 0.197*** | |||||
| (8.45) | |||||||
| BUSINESS × FSE | β5 | 0.098*** | |||||
| (4.70) | |||||||
| Control variables | Yes | Yes | Yes | Yes | Yes | Yes | |
| Constant | Yes | Yes | Yes | Yes | Yes | Yes | |
| Firm FE | Yes | Yes | Yes | Yes | Yes | No | |
| Year FE | Yes | Yes | Yes | Yes | Yes | No | |
| Industry × Year FE | No | No | No | No | No | Yes | |
| Observations | 21,618 | 21,618 | 13,109 | 21,618 | 21,618 | 21,618 | |
| R2 | 0.209 | 0.172 | 0.195 | 0.221 | 0.151 | 0.189 | |
| β1 + β3 | 0.245* | 0.061** | 0.178** | 0.434*** | − | 0.289** | |
| (t-statistics) | (1.93) | (2.01) | (2.00) | (3.49) | (2.30) | ||
Column (3) restricts the sample to firms with positive R&D expenditure. This test addresses the possibility that the baseline results are driven by firms that report zero R&D expenditure. The results remain consistent with the baseline findings. The coefficient on BUSINESS is negative and statistically significant, the coefficient on BUSINESS × OVER is positive and statistically significant, and the linear combination, β1 + β 3, is positive and statistically significant. This finding suggests that the reversal pattern also holds among firms that engage in R&D investment.
Column (4) redefines OVER using the highest quintile of firm-specific misvaluation, providing a more restrictive definition of overvaluation (e.g., Alzahrani and Rao, 2014). The results remain unchanged. BUSINESS is negative and statistically significant, BUSINESS × OVER is positive and statistically significant, and the linear combination is positive and significant at the 1% level. This result indicates that the baseline conclusion is not sensitive to the tercile cutoff used to define overvalued firms.
Column (5) replaces the indicator measure of overvaluation with the continuous firm-specific misvaluation component (FSE). The coefficient on BUSINESS remains negative, while the coefficient on BUSINESS × FSE is positive and statistically significant. Thus, the relation between CEO business education and R&D becomes more positive as FSE increases, indicating that the baseline interaction result is not driven by the discrete cutoff used to define overvalued firms.11)
Column (6) includes industry-by-year fixed effects. This specification absorbs time-varying industry-level shocks that may affect firms within the same industry-year. The coefficient on BUSINESS remains negative, whereas the coefficient on BUSINESS × OVER remains positive and statistically significant. The linear combination is also positive and statistically significant. Thus, the reversal pattern persists even after controlling for time-varying industry-level factors.
4.4 Mechanism Tests
Having established the reversal pattern across the baseline, endogeneity, and robustness analyses, we next examine the mechanisms through which stock overvaluation changes the relation between CEO business educational background and R&D investment. The baseline results show that business-educated CEOs are associated with lower R&D investment when firms are not overvalued, but higher R&D investment when firms are overvalued. This pattern may arise through different channels.
One possible channel is the equity-financing mechanism. Stock overvaluation may provide firms with favorable equity financing opportunities (Baker et al., 2003; McLean and Zhao, 2014; Warusawitharana and Whited, 2016), and business-educated CEOs may be more likely to recognize and use these opportunities to support R&D investment. Another possible channel is the catering mechanism. Stock overvaluation may increase incentives to respond to market expectations (Gao, 2010; Jensen, 2005; Jin, 2022; Polk and Sapienza, 2009), and business-educated CEOs may respond by increasing visible growth-oriented investments such as R&D. These mechanisms are not necessarily mutually exclusive.
To distinguish these mechanisms, we jointly consider financial constraints and investor horizons. Financial constraints capture the extent to which favorable equity financing opportunities are valuable to the firm. If the reversal pattern is driven by the equity financing mechanism, the positive conditional effect of CEO business educational background among overvalued firms should be more pronounced among financially constrained firms. Investor horizons capture the extent to which firms are exposed to investors with shorter trading horizons, which may intensify valuation-related market pressure. If the reversal pattern is driven by the catering mechanism, the positive conditional effect should be more pronounced among firms with short-horizon investors. We therefore divide the sample into four groups based on financial constraint status and investor horizon.
We measure financial constraints using a modified KZ index following Baker et al. (2003). Because the conventional KZ index includes Tobin’s Q, it may mechanically overlap with our stock overvaluation measure. We therefore exclude Tobin’s Q from the index and calculate the modified KZ index as follows:
In Eq. (3), CF denotes cash flow, DIV denotes cash dividends, C is cash holdings, A denotes total assets, and LEV is leverage. Firms with modified KZ index values above the annual median are classified as financially constrained, and the remaining firms are classified as financially unconstrained. Following Alzahrani and Rao (2014), we measure investor horizon using stock turnover. Specifically, the turnover ratio is calculated as the average monthly ratio of shares traded to shares outstanding over the fiscal year. A higher turnover ratio indicates that shares change hands more frequently and is therefore interpreted as reflecting a shorter investor horizon. Firms with turnover ratios above the annual median are classified as short-horizon investor firms, and the remaining firms are classified as long-horizon investor firms.
We first examine financial constraints and investor horizons separately before examining their joint classification. If the equity-financing mechanism is the primary explanation, the reversal should be more evident among financially constrained firms, for which favorable equity-financing conditions are particularly valuable. By contrast, if the catering mechanism is more relevant, the reversal should be more evident among firms with short-horizon investors, where pressure to respond to market expectations is likely to be stronger. We then combine the two dimensions in a 2 × 2 classification to examine whether the investor-horizon pattern persists across financial constraint status.
Table 8 reports the mechanism test results. Panel A presents the separate subsample analyses. Columns (1) and (2) divide the sample by financial constraint status, while Columns (3) and (4) divide the sample by investor horizon. In both the constrained and unconstrained subsamples, BUSINESS is negative and statistically significant, while BUSINESS × OVER is positive and statistically significant. The interaction coefficients are also very similar in magnitude, at 0.703 and 0.713, respectively. The conditional effects of BUSINESS among overvalued firms, β1 + β3, are 0.248 for constrained firms and 0.244 for unconstrained firms. Thus, the relation between CEO business education and R&D under overvaluation does not appear to be concentrated among financially constrained firms.
<Table 8> Mechanism tests
This table reports the mechanism test results based on subsamples classified by financial constraint status and investor horizon. Financial constraints are measured using the modified KZ index following Baker et al. (2003), excluding Tobin’s Q from the conventional KZ index. Firms with modified KZ index values above the annual median are classified as financially constrained, and the remaining firms are classified as financially unconstrained. Investor horizon is measured using stock turnover following Alzahrani and Rao (2014). Firms with turnover ratios above the annual median are classified as short-horizon investor firms, and the remaining firms are classified as long-horizon investor firms. Panel A reports separate subsample analyses by financial constraint status and investor horizon. Columns (1) and (2) divide the sample into financially constrained and unconstrained firms, respectively, while Columns (3) and (4) divide the sample into short- and long-horizon investor firms, respectively. Panel B reports the joint 2 × 2 classification based on both financial constraint status and investor horizon. Definitions of the remaining variables are provided in Table A1. Values in parentheses are t-statistics based on standard errors clustered at the firm level. The row “β1 + β3” reports the estimated sum of the coefficients on BUSINESS and BUSINESS × OVER. The value in parentheses for this row is the t-statistic from testing the null hypothesis that β1 + β3 = 0. *, **, and *** indicate statistical significance at the 10%, 5%, and 1% levels, respectively.
| Dependent variable = RDIt+1 (%) | |||||
|---|---|---|---|---|---|
| Panel A. Separate subsample analysis | |||||
| (1) | (2) | (3) | (4) | ||
| Constrained | Unconstrained | Short-horizon | Long-horizon | ||
| BUSINESS | β1 | −0.455** | −0.469** | −0.445** | −0.493** |
| (−2.25) | (−2.40) | (−2.11) | (−2.53) | ||
| OVER | β2 | 0.949*** | 0.935*** | 0.943*** | 1.000*** |
| (5.60) | (5.59) | (5.44) | (5.59) | ||
| BUSINESS × OVER | β3 | 0.703*** | 0.713*** | 0.889*** | 0.572 |
| (2.83) | (2.90) | (3.45) | (1.60) | ||
| Control variables | Yes | Yes | Yes | Yes | |
| Constant | Yes | Yes | Yes | Yes | |
| Firm FE | Yes | Yes | Yes | Yes | |
| Year FE | Yes | Yes | Yes | Yes | |
| Observations | 10,809 | 10,809 | 10,809 | 10,809 | |
| Within R2 | 0.211 | 0.215 | 0.224 | 0.221 | |
| β1 + β3 | 0.248** | 0.244** | 0.444*** | 0.079 | |
| (t-statistics) | (2.03) | (2.03) | (3.52) | (1.05) | |
| Panel B. Joint financial-constraint × investor-horizon analysis | |||||
| (1) | (2) | (3) | (4) | ||
| Constrained × Short-horizon | Constrained × Long-horizon | Unconstrained × Short-horizon | Unconstrained × Long-horizon | ||
| BUSINESS | β1 | −0.503** | −0.492*** | −0.489*** | −0.469*** |
| (−2.33) | (−2.70) | (−2.69) | (−2.61) | ||
| OVER | β2 | 0.905*** | 1.111*** | 0.965*** | 0.935*** |
| (5.57) | (6.76) | (5.99) | (5.50) | ||
| BUSINESS × OVER | β3 | 0.776*** | 0.621* | 0.851*** | 0.555 |
| (3.29) | (1.69) | (3.70) | (1.37) | ||
| Control variables | Yes | Yes | Yes | Yes | |
| Constant | Yes | Yes | Yes | Yes | |
| Firm FE | Yes | Yes | Yes | Yes | |
| Year FE | Yes | Yes | Yes | Yes | |
| Observations | 5,184 | 5,625 | 5,614 | 5,195 | |
| Within R2 | 0.193 | 0.200 | 0.208 | 0.194 | |
| β1 + β3 | 0.273** | 0.129 | 0.362*** | 0.086 | |
| (t-statistics) | (2.15) | (1.19) | (2.70) | (1.09) | |
The results differ more clearly when the sample is divided by investor horizon. In the short-horizon subsample, BUSINESS is negative and significant, whereas BUSINESS × OVER is positive and significant. The corresponding conditional effect of BUSINESS among overvalued firms is 0.444 (t = 3.52). In the long-horizon subsample, BUSINESS remains negative and significant, but BUSINESS × OVER is statistically insignificant, and the corresponding conditional effect is only 0.079 (t = 1.05). These results provide more direct evidence that the reversal pattern is associated with investor horizon rather than financial constraint status.
Panel B further examines the two dimensions jointly. The results reinforce the pattern in Panel A. The conditional effect of BUSINESS among overvalued firms is positive and statistically significant for financially constrained firms with short-horizon investors (0.273) and for financially unconstrained firms with short-horizon investors (0.362). By contrast, the corresponding effects are statistically insignificant for constrained firms with long-horizon investors (0.129) and unconstrained firms with long-horizon investors (0.086). Thus, the reversal is observed in both financial constraint groups when investor horizons are short, but not when investor horizons are long.
Taken together, the separate and joint subsample analyses point to investor horizon, rather than financial constraint status, as the dimension more closely associated with the reversal pattern. If favorable equity financing were the primary mechanism, the reversal would be expected to be concentrated among financially constrained firms. Instead, it appears across both constrained and unconstrained firms when investor horizons are short. This pattern is difficult to reconcile with a pure equity-financing explanation and is more consistent with a catering-based interpretation.
Additional analysis in Table A4 of the Appendix shows that business-educated CEOs are more likely to issue equity under overvaluation, but equity issuance itself is not significantly associated with subsequent R&D investment. This finding suggests that business-educated CEOs may use favorable equity market conditions, but such financing behavior does not appear to explain the reversal pattern in R&D investment.
4.5 Further Tests
CEO ownership status and Chaebol affiliation may provide alternative explanations for the documented relation between CEO business education and R&D investment. Prior Korean evidence suggests that owner-managers and professional managers differ in their R&D investment behavior. For example, Kim and Song (2011) find that firms managed by professional CEOs exhibit significantly lower R&D intensity than firms managed by owner CEOs. In addition, the Chaebol structure represents an important feature of the Korean corporate environment. Ryu and Cho (2021) argue that the distinctive ownership and control structure of Korean Chaebols can affect firms’ R&D expenditure behavior beyond governance characteristics at the individual-firm level. We therefore examine whether the baseline reversal varies systematically with CEO ownership status and Chaebol affiliation.
Following the Korean literature, we identify owner CEOs using the CEO’s relationship with the firm’s largest shareholder. Specifically, OWNERCEO equals one if the identified CEO is reported as the largest shareholder or a related party of the largest shareholder, and zero otherwise. This approach is consistent with prior Korean research that uses information on the largest shareholder, relatives, and related parties to distinguish owner-managers from professional managers (Kim and Kim, 2025). CHAEBOL equals one if the firm belongs to a designated business group in year t, and zero otherwise. We estimate separate three-way interaction models for OWNERCEO and CHAEBOL and include all corresponding lower-order interaction terms. This specification allows us to test directly whether the positive interaction between BUSINESS and OVER varies with CEO ownership status or Chaebol affiliation.
Table 9 reports the results. Column (1) examines CEO ownership status. The coefficient on OWNERCEO is positive and statistically significant, whereas BUSINESS × OWNERCEO is insignificant. More importantly, BUSINESS × OVER remains positive and significant, whereas BUSINESS × OVER × OWNERCEO is statistically insignificant. Thus, there is no evidence that the reversal in the relation between CEO business education and R&D under overvaluation differs systematically between owner and professional CEOs.
<Table 9> CEO ownership status, Chaebol affiliation, and the reversal effect
This table examines whether the relation between CEO business education, stock overvaluation, and subsequent R&D investment varies with CEO ownership status and Chaebol affiliation. Column (1) reports the results using CEO ownership status. OWNERCEO equals one if the CEO is identified as the largest shareholder or a related party of the largest shareholder, and zero otherwise. Column (2) reports the results using Chaebol affiliation. CHAEBOL equals one if the firm belongs to a designated business group in year t, and zero otherwise. Each specification includes all corresponding lower-order interaction terms. The coefficients on BUSINESS × OVER × OWNERCEO and BUSINESS × OVER × CHAEBOL test whether the interaction between BUSINESS and OVER differs by CEO ownership status and Chaebol affiliation, respectively. Definitions of the remaining variables are provided in Table A1. Values in parentheses are t-statistics based on standard errors clustered at the firm level. *, **, and *** indicate statistical significance at the 10%, 5%, and 1% levels, respectively.
| Dependent variable = RDIt+1 (%) | ||
|---|---|---|
| (1) | (2) | |
| Owner status | Chaebol affiliation | |
| BUSINESS | −0.443** | −0.453** |
| (−2.03) | (−2.17) | |
| OVER | 0.915*** | 0.945*** |
| (3.78) | (3.80) | |
| BUSINESS × OVER | 0.707*** | 0.743*** |
| (2.87) | (2.90) | |
| OWNERCEO | 0.167** | |
| (2.03) | ||
| BUSINESS × OWNERCEO | −0.033 | |
| (−0.45) | ||
| OVER × OWNERCEO | 0.063 | |
| (0.89) | ||
| BUSINESS × OVER × OWNERCEO | −0.005 | |
| (−0.13) | ||
| CHAEBOL | 0.323*** | |
| (5.27) | ||
| BUSINESS × CHAEBOL | 0.208*** | |
| (3.02) | ||
| OVER × CHAEBOL | −0.049 | |
| (−0.38) | ||
| BUSINESS × OVER × CHAEBOL | −0.015 | |
| (−0.16) | ||
| Control variables | Yes | Yes |
| Constant | Yes | Yes |
| Firm FE | Yes | Yes |
| Year FE | Yes | Yes |
| Observations | 21,618 | 21,618 |
| Within R2 | 0.266 | 0.259 |
Column (2) examines Chaebol affiliation. The coefficient on CHAEBOL is positive and statistically significant, and the coefficient on BUSINESS × CHAEBOL is also positive and significant. However, the coefficient on BUSINESS × OVER × CHAEBOL is statistically insignificant. Thus, although Chaebol affiliation is associated with the baseline relation between CEO business education and R&D, it does not significantly alter the reversal associated with overvaluation. Taken together, these results provide no evidence that the documented reversal differs systematically by CEO ownership status or Chaebol affiliation, suggesting that the baseline finding is unlikely to be attributable solely to these ownership and governance characteristics.
Ⅴ. Conclusion
This study examines how CEO business educational background shapes R&D investment under stock overvaluation. Using Korean listed firms from 2011 to 2023, we find a reversal in the relation between CEO business educational background and R&D investment. CEOs with business educational backgrounds are associated with lower R&D investment when firms are not overvalued. However, this negative relation reverses when firms are overvalued. Among overvalued firms, business-educated CEOs are associated with higher R&D investment than other CEOs. This evidence supports the reversal hypothesis rather than the amplification or mitigation hypothesis. More broadly, the pattern suggests that stock overvaluation shapes how business-educated CEOs translate their training in financing and capital allocation into R&D investment decisions. This finding remains robust in analyses that account for R&D persistence, mitigate concerns about potential reverse causality, address endogenous CEO appointment, and reduce observable selection bias. It also persists across alternative measures of R&D investment, alternative definitions of overvaluation, restrictions to firms with positive R&D expenditure, and industry-by-year fixed effects.
The mechanism tests suggest that this reversal pattern is difficult to reconcile with a pure equity-financing explanation and is more consistent with a catering-based interpretation. If favorable equity financing opportunities were the main channel, the positive effect of CEO business educational background among overvalued firms should be stronger among financially constrained firms. However, the results show that this effect is significant only among firms with short-horizon investors, regardless of financial constraint status. The effect is insignificant among firms with long-horizon investors, even when they are financially constrained. Additional analysis further shows that business-educated CEOs are more likely to issue equity when firms are overvalued, but equity issuance itself is not significantly associated with subsequent R&D investment. These findings do not provide strong support for the view that easier equity financing is the primary explanation for the reversal pattern. Although business-educated CEOs appear to use favorable equity market conditions under overvaluation, their R&D response does not appear to be primarily financing-driven. Rather, it is more consistent with catering incentives that may become more salient when market expectations matter more.
Taken together, the findings indicate that the effect of CEO business educational background on R&D investment is not fixed. It depends critically on stock market valuation conditions. Business education appears to be associated with a more conservative approach to R&D investment when firms are not overvalued. Yet, under overvaluation, the same educational background is associated with a stronger R&D response, especially among firms with short-horizon investors. This evidence is consistent with the view that short-horizon investor environments strengthen the association between CEO business education and R&D investment under overvaluation. Thus, this study shows that corporate R&D investment is shaped not only by CEO characteristics, but also by the valuation conditions under which those characteristics operate.
5.1 Research Implications
This study extends the upper echelons literature by showing that CEO educational background does not have a uniform effect on R&D investment. Rather, its effect depends on the valuation conditions under which CEOs make investment decisions. This finding suggests that CEO business education should be understood not only as a proxy for managerial ability or preference, but also as a factor that shapes how CEOs interpret and respond to valuation-related market signals. In this sense, CEO educational background functions as a context-dependent managerial attribute rather than as a fixed predictor of R&D investment.
The findings also have implications for how the relation between stock misvaluation and corporate investment should be interpreted. Prior studies show that overvaluation can affect real investment through financing opportunities or catering incentives. Our results suggest that this relation should not be viewed as a purely firm-level response to valuation conditions. Rather, the investment response to overvaluation may depend on the characteristics of the CEO who interprets valuation signals and translates them into investment decisions. Thus, overvaluation does not mechanically translate into R&D investment. Its effect on real investment should be understood in conjunction with managerial characteristics.
The findings also have practical implications for how R&D investment is interpreted. Increases in R&D spending are often viewed as evidence of stronger innovation commitment. Our results suggest that this interpretation may be incomplete when firms are overvalued. In such settings, R&D investment may reflect a response to valuation-related market pressure, particularly when firms are exposed to short-horizon investors. This distinction is important because increases in R&D investment among firms led by business-educated CEOs under overvaluation should not be interpreted simply as the result of improved financing capacity. They may also reflect responses to market expectations that become more salient in short-horizon investor environments. This does not imply that R&D investment under overvaluation is necessarily inefficient or value-destroying. Rather, it suggests that such investment should be interpreted in relation to the valuation environment and investor horizon in which it occurs.
The findings further suggest that investors, boards, and innovation evaluators should look beyond the amount of R&D spending. Investors and analysts should consider whether R&D increases among overvalued firms reflect sustained innovation plans or market-responsive behavior. Boards should assess the continuity and technological rationale of R&D projects, rather than focusing only on the amount of spending. More broadly, innovation evaluation frameworks should distinguish between R&D investment driven by long-term technological objectives and R&D investment induced by market pressure.
5.2 Limitations and Future Research
This study has several limitations that provide opportunities for future research. First, the analysis focuses on R&D investment rather than innovation outcomes or innovation quality. Although the results show that business-educated CEOs increase R&D investment when firms are overvalued, this study does not directly examine whether such investment leads to greater innovation output, higher-quality innovation, greater R&D efficiency, or long-term firm value. This limitation is important because R&D spending captures resource commitment, but not necessarily the economic or technological value generated by that commitment. Future research could examine whether the R&D increases documented in this study translate into patents, citation-weighted innovation outcomes, R&D efficiency, or subsequent firm performance.
A further limitation relates to the measurement of stock overvaluation. This study relies primarily on the misvaluation decomposition approach of Rhodes-Kropf et al. (2005) to identify firm-specific overvaluation. Although this approach is widely used and allows us to separate firm-specific valuation deviations from broader valuation components, overvaluation can also be measured using alternative frameworks, such as residual income models, fundamental cash-flow-based valuation measures, or forecast-based intrinsic value estimates (e.g., Bonaimé et al., 2014; Dong et al., 2021; Jin, 2022; Shen et al., 2021). Due to data limitations, this study does not fully examine whether the results hold across these alternative measures. Future research could use richer valuation data to test whether the reversal pattern documented in this study is robust across different approaches to measuring stock overvaluation.
Finally, although this study conducts several analyses to mitigate endogeneity concerns, including dynamic panel estimation, instrumental variable estimation, and propensity score matching, the findings should be interpreted cautiously in causal terms. CEO appointment decisions, valuation conditions, and R&D investment may still be jointly influenced by unobservable firm characteristics or market expectations. In addition, the mechanism tests provide evidence consistent with the catering mechanism, but they do not directly observe managerial intentions or the specific expectations imposed by investors. Future research could use exogenous shocks to valuation conditions, investor horizons, or CEO appointments to provide sharper causal evidence. Future research could also use textual disclosures, conference calls, or R&D project-level information to examine more directly how CEOs justify R&D investment decisions under stock overvaluation.
Appendix
<Table A1> Variable definitions
| Variables | Definitions |
|---|---|
| Panel A: Variables used in the baseline regression | |
| RDI | R&D intensity. Total R&D expenditures divided by total sales. |
| BUSINESS | CEO business educational background. Indicator variable equal to one if the CEO holds at least one bachelor’s, master’s, or doctoral degree in a business-related field, and zero otherwise. |
| OVER | Stock overvaluation. Indicator variable equal to one if the firm-year observation belongs to the highest tercile of the annual distribution of firm-specific misvaluation, and zero otherwise. |
| CEOAGE | CEO age. Natural logarithm of CEO age. |
| CEOOWN | CEO ownership. Proportion of shares owned by the CEO. |
| FIRMSIZE | Firm size. Natural logarithm of total assets. |
| FIRMAGE | Firm age. Natural logarithm of firm age. |
| ROA | Return on assets. Earnings before interest, taxes, depreciation, and amortization divided by total assets. |
| LEV | Leverage. Total debt divided by total assets. |
| TANG | Asset tangibility. Tangible assets divided by total assets. |
| CASH | Cash holdings. Cash and cash equivalents divided by total assets. |
| CAPEX | Capital expenditures. Capital expenditures divided by total assets. |
| GROWTH | Sales growth. Annual growth rate of total sales. |
| FOR | Foreign ownership. Proportion of shares owned by foreign investors. |
| LARGE | Large shareholder ownership. Proportion of shares owned by the largest shareholder and related parties. |
| Panel B: Variables used in additional tests | |
| RDA | Total R&D expenditures divided by lagged total assets. |
| LnRD | Natural logarithm of total R&D expenditures. |
| BUS_IND | Proportion of CEOs with business educational backgrounds in the same two-digit KSIC industry-year, excluding the focal firm. |
| EQUITY | Net equity issuance scaled by total assets. Net equity issuance is calculated as cash proceeds from seasoned equity offerings plus proceeds from the disposal of treasury shares, minus cash outflows associated with equity redemption and the acquisition of treasury shares. |
| Modified KZ | Modified KZ index following Baker et al. (2003), calculated after excluding Tobin’s Q from the conventional KZ index. |
| Turnover | Average monthly ratio of shares traded to shares outstanding over the fiscal year. |
| OWNERCEO | Indicator variable equal to one if the CEO is identified as the largest shareholder or a related party of the largest shareholder, and zero otherwise. |
| CHAEBOL | Indicator variable equal to one if the firm belongs to a designated business group, and zero otherwise. |
<Table A2> Subsample tests by valuation status
This table reports subsample regression results by valuation status. Firms are classified into undervalued, fairly valued, and overvalued groups based on the annual terciles of firm-specific misvaluation. BUSINESS is an indicator variable equal to one if the CEO has a business educational background, and zero otherwise. Definitions of the remaining variables are provided in Table A1. Values in parentheses are t-statistics based on standard errors clustered at the firm level. *, **, and *** indicate statistical significance at the 10%, 5%, and 1% levels, respectively.
| (1) | (2) | (3) | |
|---|---|---|---|
| Undervalued firms | Fairly valued firms | Overvalued firms | |
| BUSINESS | −0.397*** | −0.162* | 0.283** |
| (−5.66) | (−1.75) | (2.52) | |
| Controls and constant | Yes | Yes | Yes |
| Firm FE | Yes | Yes | Yes |
| Year FE | Yes | Yes | Yes |
| Observations | 7,211 | 7,205 | 7,202 |
| Within R2 | 0.205 | 0.194 | 0.197 |
<Table A3> Matching quality based on covariate balance
This table reports matching quality based on covariate balance for the propensity score matching analyses. Panel A reports the balance test for matching based on CEO business educational background. The treated group consists of firm-year observations led by CEOs with business educational backgrounds, and the control group consists of firm-year observations led by CEOs without such backgrounds. Panel B reports the balance test for matching based on stock overvaluation. The treated group consists of overvalued firm-year observations, and the control group consists of non-overvalued firm-year observations. Diff denotes the difference in covariate means between treated and control observations. *, **, and *** indicate statistical significance at the 10%, 5%, and 1% levels, respectively.
| Before matching | After matching | |||||
|---|---|---|---|---|---|---|
| Treated | Control | Diff. | Treated | Control | Diff. | |
| Panel A: Matching based on CEO business educational background | ||||||
| CEOAGE | 4.037 | 4.007 | 0.030* | 4.037 | 4.030 | 0.007 |
| CEOOWN | 0.025 | 0.024 | 0.001 | 0.025 | 0.024 | 0.001 |
| FIRMSIZE | 25.749 | 26.410 | −0.661** | 25.748 | 25.772 | −0.024 |
| FIRMAGE | 3.126 | 3.332 | −0.206** | 3.132 | 3.122 | 0.010 |
| ROA | 0.015 | 0.032 | −0.017** | 0.015 | 0.014 | 0.001 |
| LEV | 0.405 | 0.431 | −0.026** | 0.404 | 0.407 | −0.003 |
| TANG | 0.253 | 0.324 | −0.071** | 0.253 | 0.251 | 0.002 |
| CASH | 0.125 | 0.099 | 0.026*** | 0.125 | 0.120 | 0.004 |
| CAPEX | 0.039 | 0.044 | −0.005 | 0.038 | 0.037 | 0.001 |
| GROWTH | 0.136 | 0.108 | 0.028** | 0.136 | 0.145 | −0.008 |
| FOR | 0.051 | 0.072 | −0.021** | 0.050 | 0.054 | −0.004 |
| LARGE | 0.376 | 0.415 | −0.039** | 0.377 | 0.370 | 0.008 |
| Observations | 9,566 | 12,052 | 9,560 | 9,560 | ||
| Panel B: Matching based on stock overvaluation | ||||||
| CEOAGE | 4.060 | 4.000 | 0.060* | 4.059 | 4.049 | 0.010 |
| CEOOWN | 0.025 | 0.024 | 0.001 | 0.025 | 0.024 | 0.001 |
| FIRMSIZE | 26.380 | 25.985 | 0.395*** | 26.380 | 26.408 | −0.028 |
| FIRMAGE | 3.181 | 3.271 | −0.090** | 3.180 | 3.175 | 0.005 |
| ROA | 0.026 | 0.024 | 0.002 | 0.026 | 0.023 | 0.003 |
| LEV | 0.521 | 0.369 | 0.152*** | 0.521 | 0.521 | 0.000 |
| TANG | 0.303 | 0.288 | 0.015** | 0.302 | 0.300 | 0.002 |
| CASH | 0.105 | 0.112 | −0.007 | 0.105 | 0.106 | −0.001 |
| CAPEX | 0.050 | 0.038 | 0.012** | 0.050 | 0.051 | −0.001 |
| GROWTH | 0.172 | 0.095 | 0.077*** | 0.173 | 0.179 | −0.006 |
| FOR | 0.075 | 0.057 | 0.018** | 0.075 | 0.076 | −0.001 |
| LARGE | 0.378 | 0.408 | −0.030** | 0.377 | 0.378 | −0.001 |
| Observations | 7,202 | 14,416 | 7,185 | 7,185 | ||
<Table A4> Additional analysis of the equity-financing mechanism
This table reports additional analyses of the equity-financing mechanism. Column (1) examines whether business-educated CEOs are more likely to issue equity when firms are overvalued. Column (2) additionally includes EQUITY to examine whether equity issuance is associated with subsequent R&D investment. Definitions of the remaining variables are provided in Table A1. Values in parentheses are t-statistics based on standard errors clustered at the firm level. The row “β1 + β3” reports the estimated sum of the coefficients on BUSINESS and BUSINESS × OVER. The value in parentheses for this row is the t-statistic from testing the null hypothesis that β1 + β3 = 0. *, **, and *** indicate statistical significance at the 10%, 5%, and 1% levels, respectively.
| (1) | (2) | ||
|---|---|---|---|
| EQUITY | RDIt+1 (%) | ||
| BUSINESS | β1 | 0.010 | −0.470** |
| (0.77) | (−2.33) | ||
| OVER | β2 | 0.043*** | 0.965*** |
| (4.92) | (4.52) | ||
| BUSINESS × OVER | β3 | 0.040*** | 0.770*** |
| (3.15) | (3.14) | ||
| CEOAGE | γ1 | −0.011*** | −0.440* |
| (−2.66) | (−1.93) | ||
| CEOOWN | γ2 | −0.021** | 0.205** |
| (−2.05) | (2.26) | ||
| FIRMSIZE | γ3 | −0.010*** | 0.566*** |
| (−4.15) | (7.28) | ||
| FIRMAGE | γ4 | −0.008** | −1.267*** |
| (−2.11) | (−7.59) | ||
| ROA | γ5 | −0.255*** | 9.150*** |
| (−10.15) | (9.81) | ||
| LEV | γ6 | −0.030*** | −5.822*** |
| (−6.29) | (−5.15) | ||
| TANG | γ7 | −0.060*** | 0.975 |
| (−5.40) | (1.17) | ||
| CASH | γ8 | 0.008 | 2.244* |
| (0.80) | (1.76) | ||
| CAPEX | γ9 | 0.070* | −5.315*** |
| (1.83) | (−3.70) | ||
| GROWTH | γ10 | 0.066*** | 0.736*** |
| (5.50) | (3.50) | ||
| FOR | γ11 | −0.045*** | 1.544 |
| (−4.10) | (1.34) | ||
| LARGE | γ12 | −0.015** | −4.111*** |
| (−2.15) | (−7.20) | ||
| EQUITY | γE | 0.330 | |
| (0.62) | |||
| Constant | α | 0.188*** | −0.322** |
| (6.44) | (−2.40) | ||
| Firm FE | Yes | Yes | |
| Year FE | Yes | Yes | |
| Observations | 21,618 | 21,618 | |
| Within R2 | 0.108 | 0.256 | |
| β1 + β3 | 0.050* | 0.300** | |
| (t-statistics) | (1.78) | (2.49) |
저자 약력
∙ Jeongdae Yim is currently a contract professor in the BK21 FOUR Program at the School of Business Administration, Kyungpook National University. He received his bachelor’s, master’s, and doctoral degrees from the School of Business Administration at Kyungpook National University. After receiving his doctoral degree, he worked as a postdoctoral researcher at the School of Business Administration, Kyungpook National University, and as a lecturer at the School of Business Administration, Chonnam National University. His research interests include corporate innovation, environmental technological innovation, and corporate finance.