
.jpeg)
Universal or Contextual? A Multilevel Analysis of Review-Derived Service Attributes in Hotel Satisfaction
1 동국대학교 경영학과 Visiting Professor of marketing in the Dongguk Business School at Dongguk University(dayeonkim@dgu.ac.kr)
2 국립부경대학교 경영학부 Assistant Professor of Marketing in the Division of Business Administration at Pukyong National University(hjseo24@pknu.ac.kr)
3 부산대학교 경영학과 Professor of Marketing in the College of Business at Pusan National University (thsong@pusan.ac.kr)
교신저자(Corresponding Author): 송태호, thsong@pusan.ac.kr
DOI: https://doi.org/10.17287/kmr.2026.55.4.1721
Abstract
Understanding how service attributes are associated with customer satisfaction is vital in the hospitality industry, where customer experiences differ by brand tier, location, and property characteristics. This study analyzes 110,955 Yelp reviews from 2,952 hotels to examine the relationships among review-derived service attributes, attribute-level sentiment, attribute-level sentence frequency, and satisfaction ratings. In the text-processing stage, reviews are segmented into sentence-level units using sentence-boundary rules and tokenization. Service attributes are extracted using LDA topic modeling, and six categories are identified: Hotel Facilities, Room Comfort, Customer Service, Breakfast Service, Entertainment & Family, and Dining Experience. VADER sentiment analysis is then applied at the sentence level to measure the evaluative tone associated with each attribute. These measures are aggregated into review-attribute-level frequency and sentiment variables. A multilevel ordered logit model examines how these variables are associated with ordinal satisfaction ratings while accounting for the nesting of reviews within hotels. The results show that Customer Service and Room Comfort have strong positive average associations with satisfaction, although their effects vary across hotel contexts. Additional robustness checks that account for review length and review-year effects further support the interpretation that attribute frequency captures heterogeneous forms of salience rather than simple review length. The findings further indicate that attribute frequency and sentiment do not operate uniformly across service dimensions or hotel tiers. By integrating sentence-level attribute construction with multilevel modeling, this study distinguishes robust average satisfaction drivers from context-dependent service attributes and offers practical implications for context-sensitive service management in hotels.
Ⅰ. Introduction
Achieving high customer satisfaction is critical to gaining a competitive edge in the hospitality and tourism industry. However, identifying the specific service elements that most strongly shape customer evaluations remains a persistent challenge. Traditional survey-based frameworks, such as SERVQUAL’s dimensions of reliability and responsiveness, offer structured insights but often reflect provider-centric categories that may not fully capture customers’ nuanced and unsolicited feedback in experience-driven settings (Bi et al., 2024). For instance, customers frequently discuss a wide range of tangible and hedonic service attributes― from room comfort and cleanliness to dining options and entertainment―in their own unstructured language, revealing priorities that standardized measurement tools might overlook (Xie et al., 2016; Lee and Park, 2021; Kim et al., 2025).
Online customer reviews have emerged as a valuable alternative data source for examining service attributes that are salient to customers (Kim and Kim, 2022; Kim and Kim 2023). Prior studies in the hospitality domain have used text-mining methods to transform review narratives into measurable indicators of customer experience (Kim et al., 2026). However, many review-based studies have treated each review as a single unit of analysis or relied on aggregated measures of topics and sentiment (Mankad et al., 2016; Sann and Lai, 2023). This review-level approach may overlook the fact that a single hotel review often contains multiple service experiences across different sentences (Büschken and Allenby, 2016; Chakraborty et al., 2022). For example, a customer may positively evaluate staff service in one sentence while negatively evaluating room comfort, breakfast, or facilities in another. Thus, review-level measures can obscure attributespecific evaluations embedded within the same review.
This study addresses this issue by constructing service-attribute variables at the sentence level. Each review is segmented into sentence-level units, each sentence is assigned to a dominant service attribute, and sentiment is calculated for the corresponding attribute. This procedure yields two attribute-specific measures for each review: attribute-level sentence frequency and attribute-level sentiment. Here, frequency refers to the number of sentences assigned to a given service attribute within a review, rather than simple keyword occurrence. This sentence-level operationalization allows us to capture both what customers discuss and how they evaluate each service attribute within the same review.
Another limitation of prior research is that sentence- or review-level attribute measures are rarely linked to the hierarchical structure of hotel review data (Radojevic et al., 2017; Bi et al., 2024). Reviews are nested within hotels, and hotels differ systematically in brand tier, property type, geographic location, review volume, and rating dispersion (Anguera-Torrell and Nicolau, 2023). Ignoring this structure may lead to an incomplete understanding of whether a service attribute functions as a broadly relevant satisfaction driver or as a context-dependent driver whose effect varies across hotel contexts. For example, room comfort may represent a basic expectation in higher-tier hotels but a more salient source of satisfaction or dissatisfaction in lower-tier hotels (Kim et al., 2025). Similarly, dining, entertainment, and breakfast-related experiences may matter differently depending on hotel type, brand tier, and regional market conditions.
Building on these gaps, this study revisits the distinction between universal and contextual satisfaction drivers in hotel service evaluations. Rather than defining universal drivers as attributes that exert uniformly positive effects across all properties, we conceptualize them as attributes showing strong average associations with satisfaction while exhibiting comparatively limited contextual variation. Contextual drivers, in contrast, refer to attributes whose effects vary substantially across hotel-level characteristics, such as brand tier, hotel type, location, and rating dispersion. This distinction aligns with the logic of multilevel modeling, which estimates average attribute effects while allowing them to vary across hotels.
This study explores three main questions: (1) Which key service attributes can be identified from customer reviews at the sentence level? (2) How do attribute-level sentence frequency and sentiment relate to overall satisfaction ratings? and (3) To what degree do hotel-level characteristics, such as brand tier, hotel type, location, and reputation, condition the relationships between attribute frequency, attribute sentiment, and satisfaction within a multilevel framework?
To answer these questions, this study analyzes 110,955 Yelp reviews from 2,952 hotels. In the text-processing stage, review texts are segmented into sentence-level units using sentence-boundary rules and tokenized for subsequent analysis. Service attributes are extracted through LDA topic modeling, and the resulting topics are interpreted as service-attribute categories. VADER sentiment analysis is then applied at the sentence level to measure the evaluative tone associated with each attribute. These sentence-level measures are aggregated into review-attribute-level frequency and sentiment variables. In the empirical stage, a multilevel ordered logit model examines how these variables are associated with ordinal satisfaction ratings while accounting for the nested structure of reviews within hotels. As an additional robustness check, the analysis examines whether the main frequency-related patterns remain substantively meaningful after controlling for review length and review-year effects.
This study contributes to hospitality marketing research in three ways. First, it advances research on review-based service attributes by shifting the unit of attribute construction from the review level to the sentence level, thereby capturing multiple attribute-specific evaluations within a single review. Second, it links sentence-level attribute frequency and sentiment to a multilevel modeling framework, addressing the hierarchical structure of hotel review data. Third, it refines the universal-versus-contextual distinction by showing how service attributes can have strong average associations with satisfaction while still varying across brand tier, hotel type, location, and rating-related hotel characteristics. The findings provide practical insights for hotel managers seeking to tailor service enhancement strategies by hotel context rather than relying on a uniform attribute-management approach.
Ⅱ. Theoretical Background
2.1 Review-Derived Service Attributes and Satisfaction
Traditional frameworks, such as SERVQUAL (Parasuraman et al., 1988), offer foundational dimensions of service quality but rely on preselected categories that may not fully capture evolving customer priorities in hotel contexts. Online review platforms enable bottom-up discovery of service attributes through unsolicited customer feedback, offering a richer reflection of customer experiences(Kim and Baek, 2025). Inductive text-mining methods are useful for identifying customer-discussed attributes without imposing a priori service categories, thereby reducing the limitations of survey- driven approaches.
Topic modeling techniques have been widely used for this purpose. Latent Dirichlet Allocation (LDA), for example, discovers latent themes in review corpora by identifying clusters of frequently co-occurring words corresponding to service dimensions such as room cleanliness, staff friendliness, and breakfast quality (Blei et al., 2003; Guo et al., 2017). Although newer embedding-based and generative approaches have expanded the methodological options for topic modeling, LDA remains useful as an interpretable baseline procedure for extracting service-attribute structures from large-scale consumer reviews when the objective is transparent attribute construction rather than automated semantic generation.
At the same time, review-level topic measures can obscure multiple attribute-specific evaluations within a single review. A customer may discuss staff service, room comfort, and dining experience in different sentences, often with different evaluative tones. Sentence-based text analysis, therefore, provides a more appropriate unit for constructing attribute-level variables in review settings, where multiple service encounters are described in a single review (Büschken and Allenby, 2016; Chakraborty et al., 2022). In this study, LDA is used to derive interpretable service-attribute topics from the sentence-level corpus, which are then interpreted as service-attribute categories.
However, identifying which attributes customers discuss is not sufficient. It is also necessary to measure how customers evaluate those attributes. Lexicon-based sentiment tools such as VADER assign polarity scores to text units and are well-suited to short, informal online-review expressions because they account for intensifiers, punctuation, capitalization, and negation (Hutto and Gilbert, 2014). While transformer-based sentiment models may offer additional advantages in complex linguistic contexts, VADER provides a transparent and scalable sentiment measure for large-scale sentence-level review analysis.
Accordingly, this study adopts a sentence-level attribute-construction approach. Review texts are divided into sentence-level units, service-attribute topics are identified through LDA, and sentiment scores are computed for each sentence-level attribute mention. This approach allows the analysis to distinguish attribute salience, measured as the number of sentences assigned to an attribute within a review, from attribute sentiment, measured as the evaluative tone associated with that attribute.
2.2 Multilevel Modeling to Capture Contextual and Organizational Variations
Customer reviews are nested within hotels, which are further embedded in broader categories such as brand tiers, property types, and regional markets (Lee et al., 2017). This structure indicates that customer evaluations are not fully independent and are shaped by hotel-specific and contextual factors. Ignoring this structure risks oversimplified conclusions because variation across hotels may affect the observed relationship between service attributes and satisfaction (Raudenbush and Bryk, 2002; Radojevic et al., 2017).
Multilevel modeling provides a statistical framework for distinguishing between review-level and hotel-level variation, thereby capturing heterogeneity across organizational or contextual levels. In the hospitality domain, prior research has recognized the importance of hierarchical perspectives. For example, Assaf et al. (2015) used multilevel modeling to evaluate hotel efficiency across regions, while Radojevic et al. (2017) examined the nested effects of online ratings within hotel categories. These studies suggest that customer perceptions and satisfaction outcomes can vary systematically across hotel class, chain affiliation, and geographic conditions.
Despite this recognition, relatively few studies link sentence-level review-derived attributes to multilevel modeling. This gap is important because service attributes may show strong average relationships with satisfaction yet vary substantially across hotel contexts (Tubishat et al., 2018; Jeon et al., 2023; Kim et al., 2025). For instance, breakfast quality may influence satisfaction differently in economy hotels, where inclusive meals are central to perceptions of value, than in luxury hotels, where customers may prioritize experiential amenities. Multilevel modeling enables this study to estimate average attribute effects while examining contextual variation associated with hotel-level characteristics, thereby providing a more precise basis for distinguishing robust average drivers from context-dependent drivers.
Ⅲ. Methodology
3.1 Data
This study used data collected from Yelp, one of the largest online review platforms and a popular tool in hospitality and tourism research. Yelp provides detailed customer evaluations, including numeric star ratings (1–5 scale) and textual reviews, offering a comprehensive view of customer satisfaction. We assembled a dataset of 110,955 reviews from 2,952 hotels across the United States and Canada, spanning from 2016 to 2021. For each hotel, metadata were gathered, including brand tier (based on STR chain scale classifications, such as Luxury, Upper Upscale, Upscale, Upper Midscale, Midscale, and Economy), hotel type (e.g., hotel, casino, spa), and geographic location by state, province, or territory. The review observations and hotel counts were distributed as follows: Louisiana (383 hotels; 18,243 reviews), Florida (554 hotels; 17,144 reviews), Nevada (117 hotels; 13,873 reviews), Pennsylvania (385 hotels; 13,442 reviews), Tennessee (369 hotels; 12,692 reviews), California (130 hotels; 9,954 reviews), Missouri (194 hotels; 6,487 reviews), Arizona (188 hotels; 6,408 reviews), Indiana (253 hotels; 5,281 reviews), New Jersey (124 hotels; 2,632 reviews), Idaho (80 hotels; 2,628 reviews), Illinois (69 hotels; 836 reviews), Delaware (41 hotels; 811 reviews), Alberta, Canada (64 hotels; 518 reviews), and the U.S. Virgin Islands (1 hotel; 6 reviews). Additionally, aggregated hotel-level metrics―total review count, average star rating, and star-rating variance―were included as structural control variables. This multi-dimensional dataset enables us to analyze not only the content of individual reviews but also the broader contextual factors that influence satisfaction evaluations.
3.2 Topic Modeling
To identify service attributes from customer reviews, this study applied LDA-based topic modeling to sentence-level review units. Before topic modeling, standard text preprocessing was conducted to clean and refine the review texts. This included removing special characters, URLs, numbers, punctuation, and other non-meaningful elements, and converting all text to lowercase.
The cleaned review texts were segmented into sentence-level units using sentence-boundary rules and tokenization for subsequent analysis. In this study, sentences were used as the basic unit of attribute extraction because a single review often contains multiple service evaluations across different sentences. Following sentence segmentation and tokenization, part-of-speech tagging was used to identify the grammatical role of each word. For LDA-based topic modeling, nouns and verbs were retained because they typically represent service objects and actions explicitly mentioned by customers, such as “room,” “staff,” “breakfast,” “parking,” and “clean.” This preprocessing step helped reduce noise and sharpen the topical structure of the sentence-level review corpus. LDA was then used to extract latent service-attribute topics from the sentence-level corpus. LDA is a probabilistic topic modeling method that represents each text unit as a mixture of topics and each topic as a distribution of words (Blei et al., 2003). In this study, LDA was used as an interpretable and scalable procedure for constructing service-attribute categories from large-scale customer reviews.
Each sentence was assigned to the topic with the highest probability when the dominant-topic probability exceeded 0.50. The 0.50 threshold was adopted as a majority-probability criterion, meaning that a sentence was assigned to a service-attribute topic only when that topic accounted for more than half of the estimated topic-probability mass for the sentence. This rule was intended to improve assignment clarity and reduce weak or ambiguous topic assignments, while retaining sufficient sentence coverage for subsequent multilevel modeling. This procedure is consistent with the probabilistic interpretation of LDA topic mixtures and prior review-based applications of topic assignment (Blei et al., 2003; Kim et al., 2025).
When no topic exceeded this threshold, the adjacent sentence context was considered to support attribute assignment. The resulting topics were interpreted and labeled as service-attribute categories based on their most frequently associated words and their substantive relevance to hotel service experiences. Through this process, six service attributes were identified: Hotel Facilities, Room Comfort, Customer Service, Breakfast Service, Entertainment & Family, and Dining Experience. This procedure enabled the construction of sentence-level service-attribute indicators rather than review-level topic measures.
3.3 Sentiment Analysis
To capture the evaluative tone of customer reviews, we applied sentence-level sentiment analysis. This approach quantifies text polarity and enables measurement of customer evaluations of specific service attributes. In this study, we employed the Valence Aware Dictionary and Sentiment Reasoner (VADER), a lexicon- and rule-based sentiment analysis tool widely used for short, informal user-generated texts, such as online reviews (Hutto and Gilbert, 2014). VADER was considered appropriate for this study because it provided scalable sentence-level sentiment scoring for a large corpus of customer reviews while maintaining interpretability in how the sentiment scores were generated.
VADER assigns four sentiment scores to each sentence: positive, negative, neutral, and compound. The compound score ranges from -1 to +1 and reflects a sentence's overall sentiment polarity. Because it incorporates rule-based adjustments for intensifiers, punctuation, capitalization, and negation, the compound score was used as the primary sentiment measure in this study. This score captures the overall evaluative tone of each sentence and is therefore suitable for linking sentence-level service evaluations to overall satisfaction ratings.
After each sentence was assigned to a service-attribute topic through LDA-based topic modeling, the corresponding VADER compound score was linked to that sentence-level attribute mention. When multiple sentences within the same review referred to the same service attribute, their compound scores were averaged to construct the attribute-level sentiment score for that review. Thus, for each review, the final sentiment variable represents the average evaluative tone associated with a specific service attribute. This procedure enabled us to examine how customers’ positive or negative evaluations of different service attributes are associated with their overall satisfaction ratings.
In parallel with the sentiment measure, attribute-level sentence frequency was calculated as the number of sentences assigned to each service attribute within a review. Accordingly, the analysis captures two distinct aspects of review content: the frequency with which a service attribute is discussed and the extent to which that attribute is evaluated positively or negatively.
3.3.1 Sentence-Level Sentiment Calculation
To ensure consistency with the notation used in the multilevel model, we denote review, hotel, service attribute, and sentence by j, h, p, and s respectively. Each sentence s within review j of hotel h was classified into a specific service attribute p (e.g., hotel facilities, room comfort). Using VADER, we computed sentiment scores for each sentence. Among the four sentiment measures, the compound score was used as the final indicator, as it captures the overall polarity of the sentence while accounting for punctuation, negation, and intensity. For instance, take Sentence s within Review j of hotel h: if the review states, “The hotel was quite nice,” and the attribute is categorized as Hotel Facilities, then the sentiment score (compound) might be compoundspjh = 0.2. This score measures the evaluative tone expressed toward the relevant service attribute at the sentence level.
3.3.2 Attribute-Level Sentiment Aggregation
When multiple sentences in review j referred to the same attribute p, their compound scores were averaged to compute the attribute-level sentiment score for that review:
where Sentpjh denotes the final sentiment score of attributes p in review j for hotel h, compoundspjh is the compound score of sentence s linked to attribute p, and npjh is the number of sentences in review j of hotel h assigned to attribute p. By combining topic modeling and sentiment analysis, this approach ensures that the analysis not only identifies which service attributes customers discuss but also assesses their emotional valence toward those attributes―an essential step in linking extracted attributes to satisfaction outcomes.
3.4 Analytical Framework: Multilevel Ordered Logit Model
The hierarchical nature of hotel review data necessitates a multilevel modeling approach. Reviews are nested within hotels, and hotel-specific characteristics may systematically influence the relationship between service attributes and customer satisfaction. Because the dependent variable is an ordinal star rating, this study employs a multilevel ordered logit model that accounts for both the ordered structure of satisfaction ratings and the nesting of reviews within hotels.
3.4.1 Review-Level Model
At the review level, the dependent variable is the star rating (starsjh), which reflects customer satisfaction for review j of hotel h. The primary independent variables are the sentiment scores (Sentpjh) and frequency counts(Cntpjh) for the six extracted service attributes. The frequency count variable is defined as attribute-level sentence frequency, indicating the number of sentences assigned to service attribute p within review j of hotel h. Therefore, it captures the sentence-level salience of a service attribute rather than simple keyword occurrence. To examine whether the effect of sentiment depends on the salience of the attribute in the review, the model includes an interaction term between sentiment and count (Sentpjh × Cntpjh). A hotel-specific random intercept is included to account for unobserved heterogeneity across hotels. The review-level ordered logit model is specified as follows:
where starsjh denotes the ordinal star rating for review j of hotel h, Sentp, jh denotes the sentiment score of service attribute p, and Cntp, jh denotes the attribute-level sentence frequency of service attribute p. The threshold parameter τc separates adjacent star-rating categories in the ordered logit model. The hotel-specific intercept βoh captures unobserved heterogeneity across hotels. This formulation links sentence-level service attribute evaluations to overall satisfaction ratings while accounting for the non-independence of reviews from the same hotel.
3.4.2 Hotel-Level Model
At the hotel level, the intercept and attribute-related effects are allowed to vary across hotels and are modeled as a function of hotel-level contextual characteristics. These characteristics include location, brand tier, hotel type, total review count, average hotel star rating, and star-rating variance. Location, brand tier, and hotel type are specified as dummy variables, while total review count, average star rating, and star- rating variance are included as continuous hotel-level indicators. The hotel-specific sentiment and frequency-count effects are modeled as follows:
where βmp,h denotes the hotel-specific coefficient for service attribute p and effect type m. Here, m = 1 refers to the sentiment effect, m = 2 refers to the frequency-count effect, and m = 3 refers to the sentiment- by-count interaction effect. StateDh, BrandTierDh, and HotelTypeDh denote hotel-level dummy variables for location, brand tier, and hotel type, respectively. ReviewCounth, AvgStarh, and VarStarh denote continuous hotel-level indicators of review volume, average hotel reputation, and rating dispersion. The random component ump,h captures unexplained cross-hotel variation in the corresponding attribute effect.
The sentiment-by-count interaction term is included in the review-level model, while the hotel-level specification focuses on how hotel characteristics condition the sentiment and frequency-count coefficients. Thus, Table 3 reports cross-level effects of hotel characteristics on the attribute–satisfaction relationships. The empirical analysis estimates two main model specifications and one robustness-oriented specification. Model 1 includes the main effects of attribute-level sentiment and sentence frequency. Model 2 adds interaction terms between sentiment and sentence frequency. Model 3 additionally controls for review length, measured as the number of sentence units in each review, as well as review-year fixed effects. The hotel-level specification further examines whether the effects of attributes vary across hotel characteristics. This framework enables the analysis to distinguish attributes that show strong average associations with satisfaction from those whose effects depend more heavily on hotel-level contexts.
<Table 3> Cross-Level Effects of Hotel Characteristics on Attribute–Satisfaction Relationships
| γ | Hotel Facilities | Room Comfort | Customer Service | Breakfast Service | Dining Experience | Entertainment & Family | ||||||
|---|---|---|---|---|---|---|---|---|---|---|---|---|
| Sent. | Cnt. | Sent. | Cnt. | Sent. | Cnt. | Sent. | Cnt. | Sent. | Cnt. | Sent. | Cnt. | |
| Brand Tier (Standard: Non) | ||||||||||||
| Luxury | 1.05** (0.18) | 0.11 (0.09) | 1.32** (0.21) | -0.15* (0.07) | 1.18** (0.19) | 0.23** (0.08) | 0.89** (0.17) | 0.05 (0.06) | 1.44** (0.25) | 0.18* (0.09) | 0.97* (0.20) | 0.08 (0.05) |
| Upper Upscale | 0.66** (0.17) | 0.19 (0.08) | 0.85** (0.20) | 0.13 (0.09) | 0.73** (0.18) | 0.21* (0.09) | 0.42** (0.15) | 0.09 (0.06) | 0.58** (0.19) | 0.17* (0.08) | 0.39** (0.14) | 0.12 (0.05) |
| Upscale | 0.42** (0.15) | 0.13 (0.08) | 0.56** (0.18) | 0.08 (0.07) | 0.39** (0.15) | 0.18* (0.08) | 0.31* (0.14) | 0.07 (0.06) | 0.47** (0.17) | 0.14 (0.08) | 0.25* (0.12) | 0.10 (0.06) |
| Upper Midscale | 0.19 (0.15) | 0.07 (0.08) | 0.23 (0.17) | 0.09 (0.09) | 0.15 (0.14) | 0.12 (0.07) | 0.21 (0.13) | 0.06 (0.05) | 0.17 (0.16) | 0.10 (0.07) | 0.13 (0.11) | 0.08 (0.06) |
| Midscale | -0.38** (0.14) | -0.08 (0.07) | -0.67** (0.16) | 0.31** (0.10) | -0.42** (0.15) | -0.11 (0.08) | -0.29** (0.13) | -0.04 (0.05) | -0.52** (0.18) | -0.13 (0.07) | -0.21* (0.10) | 0.03 (0.04) |
| Economy | -0.56** (0.16) | -0.25* (0.10) | -0.89** (0.18) | 0.31** (0.11) | -0.62** (0.17) | -0.13 (0.09) | -0.35** (0.14) | -0.04 (0.06) | -0.75** (0.20) | -0.15 (0.08) | -0.27** (0.12) | -0.05 (0.05) |
| Location (State) (Standard: AB) | ||||||||||||
| AZ | -0.16 (0.14) | -0.11 (0.09) | -0.22 (0.15) | -0.18 (0.10) | -0.19 (0.13) | -0.14 (0.08) | -0.10 (0.09) | -0.08 (0.07) | -0.17 (0.14) | -0.13 (0.09) | -0.12 (0.11) | -0.07 (0.06) |
| CA | -0.23** (0.09) | -0.17* (0.07) | -0.11 (0.10) | -0.27** (0.09) | -0.18** (0.08) | -0.21** (0.08) | -0.08 (0.07) | -0.15 (0.06) | -0.23** (0.10) | -0.19* (0.08) | -0.13 (0.09) | -0.11 (0.06) |
| DE | 0.13 (0.22) | 0.10 (0.15) | 0.18 (0.24) | 0.07 (0.14) | 0.15 (0.20) | 0.12 (0.14) | 0.09 (0.17) | 0.05 (0.12) | 0.16 (0.21) | 0.11 (0.15) | 0.14 (0.18) | 0.08 (0.13) |
| FL | -0.11 (0.10) | -0.09 (0.07) | -0.14 (0.12) | -0.08 (0.08) | -0.13 (0.09) | -0.10 (0.07) | -0.06 (0.08) | -0.04 (0.06) | -0.12 (0.11) | -0.08 (0.07) | -0.09 (0.09) | -0.05 (0.06) |
| ID | 0.04 (0.18) | 0.03 (0.12) | 0.07 (0.20) | 0.02 (0.11) | 0.05 (0.17) | 0.03 (0.11) | 0.02 (0.14) | 0.01 (0.10) | 0.06 (0.18) | 0.03 (0.12) | 0.03 (0.15) | 0.02 (0.10) |
| IL | -0.09 (0.16) | -0.07 (0.11) | -0.12 (0.17) | -0.06 (0.10) | -0.10 (0.15) | -0.08 (0.10) | -0.05 (0.12) | -0.03 (0.09) | -0.11 (0.16) | -0.07 (0.11) | -0.08 (0.13) | -0.04 (0.09) |
| IN | -0.17 (0.14) | -0.13 (0.10) | -0.21 (0.15) | -0.11 (0.09) | -0.19 (0.13) | -0.14 (0.09) | -0.10 (0.11) | -0.06 (0.08) | -0.20 (0.14) | -0.12 (0.10) | -0.15 (0.12) | -0.08 (0.08) |
| LA | 0.25* (0.12) | 0.19* (0.09) | 0.31** (0.11) | 0.22* (0.10) | 0.27** (0.10) | 0.15 (0.09) | 0.18* (0.08) | 0.12 (0.07) | 0.29** (0.11) | 0.17* (0.08) | 0.21* (0.10) | 0.14 (0.07) |
| MO | -0.06 (0.13) | -0.05 (0.09) | -0.08 (0.14) | -0.04 (0.08) | -0.07 (0.12) | -0.05 (0.08) | -0.03 (0.10) | -0.02 (0.07) | -0.07 (0.13) | -0.05 (0.09) | -0.05 (0.11) | -0.03 (0.07) |
| NJ | -0.15 (0.14) | -0.12 (0.10) | -0.19 (0.15) | -0.10 (0.09) | -0.17 (0.13) | -0.13 (0.09) | -0.09 (0.11) | -0.05 (0.08) | -0.18 (0.14) | -0.11 (0.10) | -0.13 (0.12) | -0.07 (0.08) |
| NV | 0.07 (0.15) | 0.05 (0.10) | 0.09 (0.16) | 0.04 (0.09) | 0.08 (0.14) | 0.06 (0.09) | 0.04 (0.11) | 0.02 (0.08) | 0.08 (0.15) | 0.06 (0.10) | 0.06 (0.12) | 0.03 (0.08) |
| PA | -0.08 (0.11) | -0.06 (0.08) | -0.10 (0.12) | -0.05 (0.07) | -0.09 (0.10) | -0.07 (0.07) | -0.04 (0.08) | -0.03 (0.06) | -0.09 (0.11) | -0.06 (0.08) | -0.07 (0.09) | -0.04 (0.06) |
| TN | -0.04 (0.13) | -0.03 (0.09) | -0.05 (0.14) | -0.02 (0.08) | -0.04 (0.12) | -0.03 (0.08) | -0.02 (0.10) | -0.01 (0.07) | -0.05 (0.13) | -0.03 (0.09) | -0.03 (0.11) | -0.02 (0.07) |
| VI | -0.31 (0.28) | -0.24 (0.19) | -0.39 (0.30) | -0.20 (0.17) | -0.35 (0.26) | -0.27 (0.18) | -0.18 (0.21) | -0.11 (0.15) | -0.37 (0.28) | -0.23 (0.19) | -0.27 (0.23) | -0.15 (0.16) |
| Hotel Type (Standard: Hotel) | ||||||||||||
| Casino | -0.14 (0.10) | -0.10 (0.07) | -0.17 (0.11) | -0.09 (0.06) | -0.16 (0.09) | -0.12 (0.06) | -0.08 (0.07) | -0.05 (0.05) | -0.16 (0.10) | -0.11 (0.07) | -0.12 (0.08) | -0.07 (0.05) |
| Spa | 0.01 (0.03) | 0.01 (0.02) | 0.02 (0.03) | 0.01 (0.02) | 0.01 (0.03) | 0.01 (0.02) | 0.01 (0.02) | 0.00 (0.01) | 0.01 (0.03) | 0.01 (0.02) | 0.01 (0.02) | 0.00 (0.01) |
| Review and Rating | ||||||||||||
| # of Total Review | 0.12* (0.04) | 0.13* (0.05) | 0.08 (0.05) | 0.19* (0.07) | 0.11 (0.06) | 0.16* (0.07) | 0.07 (0.05) | 0.10 (0.06) | 0.09 (0.06) | 0.15* (0.07) | 0.06 (0.05) | 0.11 (0.06) |
| Avg. Star by Hotel | 0.89** (0.15) | 0.26** (0.09) | 0.85** (0.17) | 0.13 (0.08) | 0.63** (0.14) | 0.21** (0.09) | 0.42** (0.12) | 0.09 (0.07) | 0.58** (0.16) | 0.17* (0.08) | 0.39** (0.13) | 0.12 (0.07) |
| Star Variance | -0.22** (0.08) | -0.15* (0.07) | -0.30** (0.09) | -0.11 (0.06) | -0.25** (0.08) | -0.09 (0.06) | -0.18* (0.07) | -0.07 (0.05) | -0.27** (0.10) | -0.12 (0.07) | 0.21* (0.09) | -0.08 (0.05) |
Notes: Standard errors are reported in parentheses. * p < .05; ** p < .01
Ⅳ. Results
4.1 Service Attributes
Table 1 presents the six service attributes extracted from the online hotel reviews using the sentence-level LDA topic modeling procedure. Each attribute is associated with representative vocabulary terms that customers frequently mention, reflecting distinct dimensions of the hotel experience.
<Table 1> Extracted Service Attributes and Associated Words.
| No. | Service Attributes | Top Associated Words |
|---|---|---|
| 1 | Customer Service | room, hotel, desk, staff, front, stay, service, called, manager, checkout, asked, night, call, customer, reservation, booking, guest, phone, people, staff, experience, check-in, card, issue, someone |
| 2 | Hotel Facilities | hotel, room, stay, staff, location, place, parking, restaurant, area, night, service, view, street, breakfast, everything, bar, walk, pool, recommend, beach, staying, walking, experience, lobby, property, |
| 3 | Room Comfort | room, hotel, bed, place, night, door, floor, stay, bathroom, get, shower, towel, wall, stayed, smell, sheet, people, toilet, elevator, water, sleep, look, star, thing, work, cleaned, staff, hair, desk, need |
| 4 | Breakfast Service | breakfast, coffee, morning, egg, room, water, bed, area, tv, hotel, fridge, bathroom, pool, shower, microwave, towel, staff, suite, desk, stay, machine, wifi, use, lobby, get, ice, work, kitchen, size, king |
| 5 | Entertainment & Family | pool, resort, casino, family, place, kid, get, area, people, reno, lot, beach, park, game, spa, play, machine, fee, fun, money, want, site, see, love, thing, slot, enjoy, need, food, child |
| 6 | Dining Experience | food, drink, dining, bar, service, restaurant, dinner, wedding, bartender, order, place, menu, table, experience, cocktail, server, wine, meal, friend, event, beer, buffet, lunch, staff, party, night, glass |
First, the customer service attribute encompasses a broad range of interactions between customers and hotel staff, including terms such as “room,” “desk,” “staff,” “front,” “manager,” “checkout,” “reservation,” and “guest.” These words suggest a focus on personnel responsiveness, professionalism, and problem resolution. Second, the hotel facilities attribute captures the hotel's physical and functional infrastructure. Representative terms include “parking,” “restaurant,” “pool,” “beach,” “lobby,” “property,” and “view,” indicating features that contribute to customer comfort and convenience. Third, Room Comfort covers elements of the guest room environment, with key terms such as “bed,” “bathroom,” “shower,” “cleaned,” “sleep,” and “towel“ highlighting the importance of cleanliness, comfort, and quality in-room amenities. Fourth, the breakfast service reflects customers’ breakfast-related dining experiences. This attribute includes words like “coffee,” “egg,” “fridge,” “microwave,” “wifi,” and “kitchen,” highlighting both food quality and service factors that affect morning meals. Fifth, Entertainment & Family attribute represents leisure and family-friendly offerings, with terms such as “pool,” “casino,” “family,” “kid,” “park,” “game,” and “spa.“ These features often improve the overall customer experience by offering recreational options. Lastly, the Dining Experience attribute, which encompasses food and beverage services beyond breakfast, includes top terms such as “food,” “dining,” “restaurant,” “cocktail,” “bartender,” and “buffet,” emphasizing both the culinary and social aspects of hospitality.
These extracted attributes confirm that online reviews capture a wide range of service dimensions, encompassing both functional (e.g., room comfort, facilities) and experiential or hedonic factors (e.g., entertainment & family, dining), enabling an in-depth investigation of the multiple facets that influence customer satisfaction. This holistic attribute set provides a rich foundation for subsequent sentiment and hierarchical modeling analyses.
4.2 Effects of Service Attributes on Customer Satisfaction
Table 2 presents the estimated associations between the six service attributes and customer satisfaction. Models 1 and 2 serve as the primary multilevel ordered logit specifications. Model 1 includes the main effects of attribute-level sentiment and sentence frequency, while Model 2 adds sentiment-by-frequency interaction terms.
<Table 2> Effects of Service Attributes on Customer Satisfaction (Multilevel Ordered Logit Model)
| Variables | Model 1 | Model 2 | Model 3 | Model 4 | |
|---|---|---|---|---|---|
| Hotel Facilities | Sentiment | 0.410** (0.080) | 0.390** (0.080) | 0.070** (0.002) | 0.173** (0.010) |
| Count | -0.017* (0.007) | -0.012 (0.007) | -0.054** (0.002) | -0.082 (0.009) | |
| Sentiment×Count | 0.090* (0.040) | 0.005** (0.001) | 0.124* (0.014) | ||
| Room Comfort | Sentiment | 0.580** (0.090) | 0.550** (0.090) | 0.002 (0.002) | 0.117* (0.020) |
| Count | -0.110**0.030) | -0.090** (0.030) | -0.112** (0.003) | -0.188** (0.007) | |
| Sentiment×Count | -0.100* (0.040) | 0.041** (0.006) | 0.520** (0.073) | ||
| Customer Service | Sentiment | 0.630** (0.090) | 0.610** (0.090) | 0.001** (0.000) | 0.085* (0.048) |
| Count | 0.080** (0.020) | 0.070** (0.020) | 0.138** (0.003) | 0.536** (0.015) | |
| Sentiment×Count | 0.150** (0.050) | 0.001 (0.001) | 0.080** (0.113) | ||
| Breakfast Service | Sentiment | 0.220** (0.070) | 0.210** (0.070) | 0.030** (0.007) | 0.022** (0.008) |
| Count | 0.020 (0.010) | 0.010 (0.010) | 0.135** (0.003) | 0.331 (0.007) | |
| Sentiment×Count | 0.060 (0.040) | 0.019** (0.003) | 0.069* (0.009) | ||
| Dining Experience | Sentiment | 0.150* (0.070) | 0.130* (0.070) | 0.694** (0.027) | 0.199** (0.008) |
| Count | 0.070** (0.020) | 0.060** (0.020) | 0.018** (0.004) | 0.105** (0.008) | |
| Sentiment×Count | 0.120* (0.050) | 0.036** (0.007) | 0.044** (0.005) | ||
| Entertainment & Family | Sentiment | 0.110* (0.050) | 0.100* (0.050) | 0.174** (0.016) | 0.091** (0.008) |
| Count | 0.060* (0.030) | 0.050* (0.030) | -0.005* (0.002) | 0.014 (0.009) | |
| Sentiment×Count | 0.070 (0.040) | -0.001 (0.000) | 0.001(0.000) | ||
| Review Length | 0.032** (0.001) | 0.102** (0.011) | |||
| Year | 2017 | 0.004 (0.007) | 0.007 (0.019) | ||
| 2018 | 0.015* (0.008) | 0.032 (0.019) | |||
| 2019 | 0.024** (0.008) | 0.058** (0.019) | |||
| 2020 | 0.072** (0.007) | 0.232** (0.023) | |||
| 2021 | 0.086** (0.007) | 0.253** (0.021) | |||
| Threshold (τ) | Threshold 1/2 | -4.650** (0.330) | -4.720** (0.340) | -4.329** (0.231) | -4.554** (0.031) |
| Threshold 2/3 | -2.180** (0.310) | -2.250** (0.320) | -1.291** (0.107) | -0.923** (0.007) | |
| Threshold 3/4 | 0.550** (0.170) | 0.580** (0.180) | 0.066** (0.006) | 0.141** (0.006) | |
| Threshold 4/5 | 2.870** (0.320) | 2.930** (0.330) | 1.558** (0.006) | 4.880** (0.006) | |
| Model fit | AIC | 37,570 | 37,420 | 34,001 | 34,001 |
| BIC | 37,590 | 37,450 | 34,027 | 34,027 | |
| Pseudo R2 | 0.175 | 0.182 | 0.188 | 0.188 | |
Notes: Standard errors are reported in parentheses. * p < .05; ** p < .01
Model 3 is included as a supplementary specification with additional controls for review length and review-year fixed effects. Review length is measured as the number of sentence units in each review, and review-year fixed effects account for temporal variation in review patterns and satisfaction ratings during the 2016–2021 period. Therefore, the substantive interpretation focuses primarily on Models 1 and 2, particularly Model 2, because it includes both the main effects and the sentiment-by-frequency interaction terms. Model 3 is used to examine whether the main frequency-related findings are sensitive to textual volume and period-specific variation. Model 4 further provides a standardized version of Model 3, in which continuous predictors, including attribute-level sentiment, sentence frequency, and review length, are z-standardized, and the interaction terms are constructed using standardized sentiment and standardized frequency variables. Model 4 is included as a supplementary sensitivity specification to examine whether the findings are sensitive to variable scaling and to improve the interpretability of interaction terms, whose main effects depend on the reference point of the interacting variables.
Figure 1 illustrates the key coefficients from the primary specifications in Table 2, focusing on sentiment, count, and sentiment-by-count interaction effects across the six service attributes.
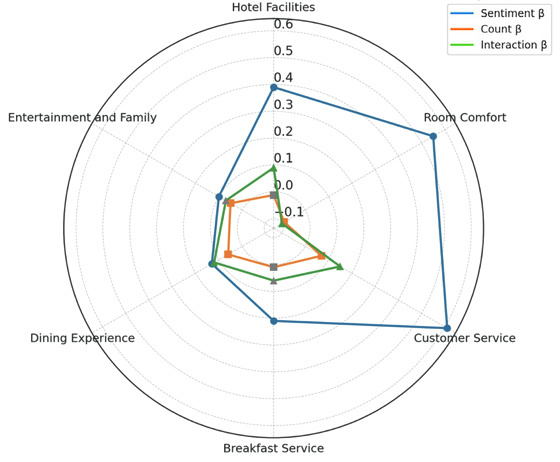
The substantive interpretation focuses primarily on Models 1 and 2, with particular emphasis on Model 2, which includes both the main effects and the sentiment-by- frequency interaction terms. Models 3 and 4 serve as supplementary specifications: Model 3 adds review length and review-year fixed effects, while Model 4 standardizes the continuous predictors in Model 3 to assess whether the key findings are sensitive to variable scaling. This standardized specification is useful because, in models with interaction terms, main-effect coefficients are conditional on the reference value of the interacting variable rather than unconditional average effects (Aiken and West, 1991; Afshartous and Preston, 2011).
In the primary specifications (Models 1 and 2), sentiment coefficients are positive and statistically significant across all six service attributes. This indicates that a more positive evaluative tone toward a service attribute is associated with a higher likelihood of a higher satisfaction rating. The strongest average sentiment associations are observed for Customer Service, Room Comfort, and Hotel Facilities. In Model 1, Customer Service shows the largest coefficient (0.630, p < .01), followed by Room Comfort (0.580, p < .01) and Hotel Facilities (0.410, p < .01). Model 2 yields a similar pattern after including sentiment-by-frequency interaction terms, with Customer Service (0.610, p < .01), Room Comfort (0.550, p < .01), and Hotel Facilities (0.390, p < .01) remaining strongly associated with satisfaction. These findings suggest that Customer Service and Room Comfort are strong average satisfaction drivers in the full-sample model, though they should not be interpreted as uniformly positive drivers across all hotel contexts
The effects of attribute-level sentence frequency are more mixed. Room Comfort shows a negative and statistically significant coefficient in both Model 1 (-0.110, p < .01) and Model 2 (-0.090, p < .01), suggesting that frequent discussion of room-related issues may reflect problem-focused or dissatisfaction-oriented review content. Hotel Facilities also shows a small negative coefficient in Model 1 (-0.017, p < .05), but this effect becomes statistically nonsignificant when the interaction terms are included in Model 2. By contrast, Customer Service, Dining Experience, and Entertainment & Family show positive and statistically significant sentence-frequency effects in the primary specifications. For example, Customer Service remains positively associated with satisfaction in both Model 1 (0.080, p < .01) and Model 2 (0.070, p < .01). These results indicate that attribute salience does not have a uniform meaning across service dimensions: frequent mentions may reflect positive engagement for some attributes, while repeated mentions may signal unresolved concerns or complaints for others.
The negative or weakened frequency effects for Room Comfort and Hotel Facilities can be interpreted through the lens of the Kano model. Core service attributes, such as Room Comfort and Hotel Facilities, often function as Must-Be or One-dimensional attributes: when adequately delivered, customers may take them for granted; however, when they fail to meet expectations, they become highly salient in reviews and are more likely to be associated with dissatisfaction (Kano et al., 1984; Matzler and Hinterhuber, 1998; Kim et al., 2025). Thus, frequent mentions of these core attributes may reflect negative disconfirmation, unresolved service problems, or unmet baseline expectations rather than their positive importance.
The interaction results in Model 2 further clarify how sentiment and salience jointly relate to satisfaction. Positive and statistically significant interaction effects are found for Customer Service (0.150, p < .01), Dining Experience (0.120, p < .05), and Hotel Facilities (0.090, p < .05). These results suggest that when these attributes are more salient in a review, positive sentiment toward them is more strongly associated with higher satisfaction ratings. In contrast, Room Comfort shows a negative interaction effect (-0.100, p < .05), indicating that the positive association between room-related sentiment and satisfaction weakens as room comfort is discussed more frequently. This pattern is consistent with the interpretation that repeated discussion of room comfort often occurs in contexts where customers are reporting concrete problems or unmet expectations. Breakfast Service and Entertainment & Family do not show statistically significant interaction effects in Model 2, suggesting that their sentiment effects are less dependent on within-review sentence frequency in the full-sample specification.
Model 3 further controls for review length and review-year fixed effects. Review length is positively associated with satisfaction (0.032, p < .01), suggesting that longer reviews tend to correspond to higher ratings after accounting for attribute-level sentiment and frequency. Because review length has been treated in prior online review research as an indicator of review depth or textual richness rather than merely as a mechanical source of noise, this result suggests that longer reviews may contain more elaborate evaluations of the service experience (Mudambi and Schuff, 2010; Ghose and Ipeirotis, 2011). The year fixed effects show a modest upward shift over time, with positive and significant coefficients from 2018 onward and larger estimates in 2020 (0.072, p < .01) and 2021 (0.086, p < .01). However, because the upward pattern began before 2020, the results may not be interpreted as a clearly distinctive COVID-19 pattern. Rather, the year effects indicate broader period-specific variation in rating behavior and review contexts during 2016–2021.
Overall, Model 3 broadly confirms the frequency-related patterns observed in Models 1 and 2, while introducing several refinements after controlling for review length and review-year fixed effects. Most notably, Breakfast Service frequency becomes positive and statistically significant (0.135, p < .01), whereas it was positive but nonsignificant in the primary specifications. Its sentiment-by-frequency interaction also becomes positive and significant (0.019, p < .01), suggesting that breakfast-related mentions are more strongly associated with satisfaction when accompanied by positive sentiment. In addition, Entertainment & Family frequency becomes slightly negative and statistically significant (-0.005, p < .05), while its interaction term turns negative but remains nonsignificant. This may indicate that entertainment- or family-related mentions receive more mixed evaluations once overall review length and period-specific variation are considered. These changes suggest that some frequency-related estimates are sensitive to the inclusion of textual volume and period-specific controls, which is plausible because attribute-level sentence counts are partly related to overall review length.
Model 4 provides a standardized version of Model 3 and shows that the main direction of several key Model 2 findings is broadly retained after standardization. Because the model includes sentiment-by-frequency interactions, differences between Models 3 and 4 should be understood primarily as differences in scaling and reference points rather than as contradictory results. In particular, the Customer Service count remains positive, the Room Comfort count remains negative, and the Dining Experience count remains positive. These patterns are broadly consistent with the main interpretation from Model 2.
In summary, the results in Table 2 show strong conditional relationships between attribute-level sentiment and satisfaction, particularly for Customer Service and Room Comfort. However, the mixed-frequency effects and significant sentiment-by-frequency interactions indicate that service attributes should not be treated as universal drivers. Instead, the results suggest that the roles of attribute sentiment and frequency vary by service dimension and warrant further examination across hotel contexts.
4.3 Cross-Level Effects of Hotel Characteristics
Table 3 and Figure 2 summarize how hotel-level characteristics condition the attribute–satisfaction relationships. In the multilevel framework, these coefficients indicate whether the review-level effects of attribute sentiment and sentence frequency differ across hotel contexts, such as brand tier, location, hotel type, review volume, average hotel rating, and rating dispersion. Thus, the estimates in Table 3 should be interpreted as cross-level effects on attribute-related coefficients rather than as direct effects on satisfaction ratings. For example, a positive coefficient indicates that the corresponding hotel-level characteristic strengthens the attribute–satisfaction relationship relative to the reference category, whereas a negative coefficient indicates that the relationship becomes weaker or more negative under that hotel-level condition.
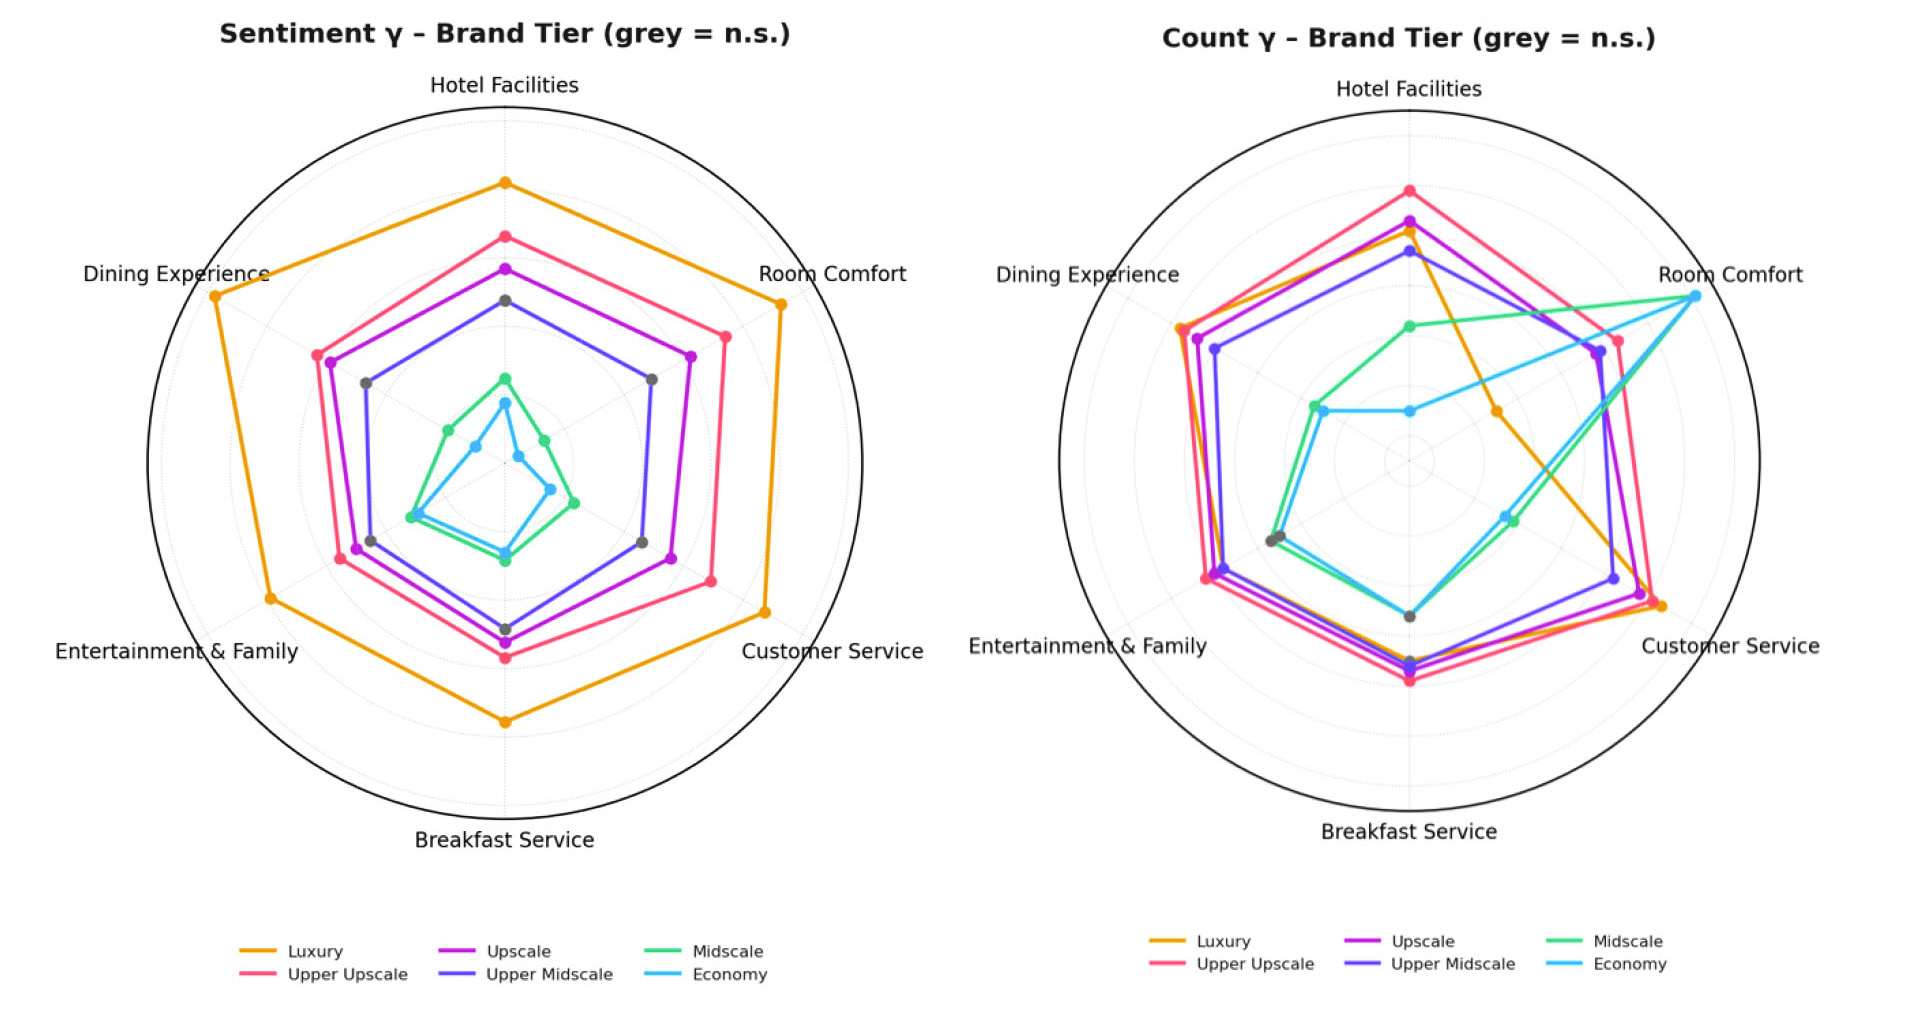
Brand tier shows the clearest source of contextual heterogeneity. For higher-tier hotels, especially Luxury, Upper Upscale, and Upscale properties, sentiment-related coefficients are generally positive and statistically significant across several attributes. For example, Luxury hotels show strong positive sentiment-related coefficients for Dining Experience (1.44, p < .01), Room Comfort (1.32, p < .01), Customer Service (1.18, p < .01), and Hotel Facilities (1.05, p < .01). These results suggest that in higher-tier hotels, positive evaluations of both core and experiential service attributes are strongly associated with higher satisfaction ratings.
By contrast, Midscale and Economy hotels show weaker or negative sentiment-related coefficients for several attributes. For instance, Economy hotels show negative coefficients for Room Comfort (-0.89, p < .01), Dining Experience (-0.75, p < .01), Customer Service (-0.62, p < .01), Hotel Facilities (-0.56, p < .01), and Breakfast Service (-0.35, p < .01). These sign reversals indicate that service attributes do not operate uniformly across hotel tiers. Therefore, attributes that show strong positive average associations in Table 2 should be interpreted as robust average drivers rather than as universally positive drivers across all properties.
The count-related cross-level effects also vary by brand tier, although the pattern is more selective than that of the sentiment effects. In higher-tier hotels, Customer Service count effects are positive and significant for Luxury (0.23, p < .01), Upper Upscale (0.21, p < .05), and Upscale hotels (0.18, p < .05). Dining Experience count effects are also positive for Luxury (0.18, p < .05) and Upper Upscale hotels (0.17, p < .05). In contrast, Room Comfort count effects are positive and significant for Midscale (0.31, p < .01) and Economy hotels (0.31, p < .01), while the corresponding sentiment effects are negative. This suggests that room comfort is highly salient in lower-tier hotels, but frequent discussion of this attribute may often arise in problem-focused evaluation contexts.
Regional effects are more selective. California shows negative and statistically significant coefficients for several attributes, including Hotel Facilities sentiment (-0.23, p < .01), Room Comfort count (-0.27, p < .01), Customer Service sentiment (-0.18, p < .01), and Dining Experience sentiment (-0.23, p < .01). Louisiana, by contrast, shows positive coefficients for several sentiment effects, including Room Comfort (0.31, p < .01), Customer Service (0.27, p < .01), Dining Experience (0.29, p < .01), and Hotel Facilities (0.25, p < .05). Because most other state coefficients are not statistically significant, the results suggest selective regional heterogeneity rather than a broad geographic pattern.
Hotel-type effects are relatively limited. Casino and Spa coefficients are mostly nonsignificant across the service attributes. Thus, the results do not provide strong evidence that hotel type, as specified in this model, systematically moderates the relationships between service attributes and satisfaction.
Review- and rating-related hotel characteristics provide additional evidence of contextual variation. Average hotel star rating is positively and significantly associated with several sentiment effects, including Hotel Facilities (0.89, p < .01), Room Comfort (0.85, p < .01), Customer Service (0.63, p < .01), Breakfast Service (0.42, p < .01), Dining Experience (0.58, p < .01), and Entertainment & Family (0.39, p < .01). By contrast, star-rating variance is negatively associated with several sentiment effects, including Hotel Facilities (-0.22, p < .01), Room Comfort (-0.30, p < .01), Customer Service (-0.25, p < .01), Breakfast Service (-0.18, p < .05), and Dining Experience (-0.27, p < .01). These results suggest that hotels with stronger average reputations benefit more from positive attribute evaluations, whereas greater rating dispersion weakens the association between attribute sentiment and satisfaction. This pattern underscores the role of consistency in customer experiences.
Figure 2 visualizes brand-tier differences in sentiment and sentence-frequency coefficients across the six service attributes. The sentiment panel shows that higher-tier hotels generally display stronger positive sentiment-related coefficients, particularly for Dining Experience, Room Comfort, Customer Service, and Hotel Facilities. The count panel shows that frequency effects are more attribute-specific: Customer Service and Dining Experience counts are more relevant in higher-tier segments, whereas Room Comfort count effects are more pronounced in Midscale and Economy hotels.
Overall, the results show that service attributes differ not only in their average associations with satisfaction but also in the extent to which their effects vary across hotel-level contexts. Customer Service and Room Comfort show strong average associations in the full-sample model, yet their effects still vary by brand tier and other hotel characteristics. Dining Experience and Entertainment & Family show more context-sensitive patterns, particularly across brand tiers. These findings support a revised universal-versus-contextual distinction: some attributes serve as robust drivers of average satisfaction, whereas others function primarily as contextual drivers whose effects depend on hotel characteristics.
Ⅴ. Conclusion and Implications
This study examined how review-derived service attributes are associated with customer satisfaction in the hotel industry using a multilevel ordered logit framework. By constructing service-attribute measures at the sentence level and linking them to hotel-level contextual characteristics, this study provides a more fine-grained understanding of how customers evaluate different dimensions of the hotel experience.
Several key findings emerge from the analysis. First, attribute-level sentiment is positively associated with satisfaction across all six extracted service attributes. Customer Service and Room Comfort show particularly strong average associations with satisfaction, followed by Hotel Facilities. These findings indicate that the evaluative tone of core service experiences plays an important role in overall satisfaction ratings. However, these attributes should be interpreted as robust average drivers rather than uniformly positive drivers across all hotel properties.
Second, attribute-level sentence frequency shows more differentiated patterns. Frequent discussion of Customer Service and Dining Experience is positively associated with satisfaction, whereas frequent discussion of Room Comfort is negatively associated with satisfaction. This suggests that attribute frequency should not be interpreted as a simple measure of attribute importance. Rather, frequency reflects attribute salience, which may stem from either positive engagement or problem-focused evaluation, depending on the service dimension. This interpretation aligns with the Kano model's logic (Kim et al., 2025): repeated mentions of basic service attributes may signal unmet baseline expectations rather than indicate the importance of those attributes, particularly when those attributes are viewed as core requirements of the hotel experience. Additional robustness results controlling for review length and review-year fixed effects provide further support for this service-dimension-specific interpretation of attribute frequency.
Third, the cross-level results show that service-attribute effects vary systematically across hotel characteristics. Brand tier represents the clearest source of heterogeneity. In higher-tier hotels, positive sentiment toward both core and experiential service attributes is strongly associated with satisfaction. In contrast, Midscale and Economy hotels show weaker or negative sentiment-related coefficients for several attributes, indicating that the same service attribute may operate differently depending on hotel context. Regional differences and rating-related indicators, particularly average hotel rating and rating variance, further demonstrate that satisfaction formation is conditioned by hotel-level characteristics.
This study contributes to hospitality marketing research in three ways. First, it advances review-based service attribute research by shifting the unit of attribute construction from the review level to the sentence level, thereby capturing multiple attribute-specific evaluations embedded within a single review. Second, it integrates attribute-level sentence frequency, attribute-level sentiment, and multilevel ordered logit modeling to account for the nested structure of hotel review data. Third, it refines the universal-versus-contextual distinction by showing that some service attributes have strong average associations with satisfaction yet exhibit meaningful contextual variation across hotel tiers, locations, and rating-related characteristics.
The findings also have managerial implications. For higher-tier hotels, managing sentiment around service interactions, room comfort, facilities, and dining experiences is especially important because positive evaluations of these attributes are strongly associated with satisfaction in these segments. For Midscale and Economy hotels, managers should pay close attention to repeated mentions of core service attributes, especially Room Comfort, because frequent discussion may indicate unresolved service failures or unmet baseline expectations. More broadly, hotels should avoid applying a uniform service-improvement strategy across all properties and should calibrate service priorities according to brand tier, regional market conditions, and the stability of prior customer evaluations.
In summary, this study shows that customer satisfaction depends not only on which service attributes customers mention but also on how they evaluate those attributes and, on the hotel, the level conditions under which those evaluations occur. By combining sentence-level attribute construction, VADER-based sentiment analysis, and multilevel ordered logit modeling, this study offers a framework for distinguishing robust average satisfaction drivers from context- dependent service attributes in hotel review data.
Ⅵ. Limitations and Future Research Directions
This study provides insights into how review-derived service attributes are associated with hotel customer satisfaction, but several limitations remain. First, the analysis relies on online reviews from a single platform, Yelp. Although Yelp provides a large and rich source of user-generated review data, its user base may differ from that of other hospitality platforms, such as TripAdvisor, Booking.com, or Google Reviews. Future research should examine whether the present findings generalize across multiple review platforms and hospitality markets. Combining platform data with survey-based measures would also help validate whether review- derived attributes correspond to customers' broader service expectations.
Second, this study used LDA-based topic modeling to extract service-attribute categories from sentence-level review data. LDA is transparent, scalable, and compatible with regression-based modeling, but it relies on a bag-of-words representation and may be less effective at capturing contextual meaning in short or ambiguous review sentences. This limitation should be considered in light of the present study's purpose. The primary objective was not to benchmark topic-modeling algorithms but to construct interpretable sentence-level service-attribute variables and examine how these variables relate to satisfaction within a multilevel framework. Nevertheless, the selection and labeling of the final six attributes remain partly interpretive. Future research should further validate attribute construction using topic-coherence metrics, alternative topic counts, subsample stability checks, and human-coded evaluation. Prior research suggests that topic-model quality should be assessed not only by automated fit indicators but also by semantic interpretability, assignment stability, and predictive relevance (Chang et al., 2009; Lau et al., 2014; Röder et al., 2015; Doogan and Buntine, 2021; Kim et al., 2026). Future research could also extend the present LDA-based approach by comparing it with transformer-based topic modeling, embedding-based classification, and LLM-assisted attribute assignment. These comparisons would help assess whether context-sensitive language models yield more stable or semantically refined service-attribute structures and whether the satisfaction-model results remain consistent across model families.
Third, although this study moved beyond review-level aggregation by constructing service- attribute variables at the sentence level, sentence-level analysis is not free from ambiguity. Some review sentences may contain more than one service attribute, while others may require neighboring sentences for interpretation. The present study partially addressed this issue by using sentence-boundary rules, dominant-topic assignment, and adjacent sentence context when topic probabilities were ambiguous. Future research could extend this approach through larger-scale sentence-level validation in which human evaluators assess both topic assignment and sentiment classification. Such validation would allow researchers to compare LDA-based assignments with transformer- or GPT-based classifications and examine whether sentence-level attribute measures remain stable across model families.
Fourth, this study relied on VADER for sentence-level sentiment analysis. VADER is useful for large-scale review analysis because it is transparent, computationally efficient, and suited to short user-generated text (Hutto and Gilbert, 2014). Given that the purpose of this study is to integrate sentence-level sentiment measures into a multilevel satisfaction model, VADER provides an interpretable and scalable operational measure of evaluative tone. However, as a lexicon- and rule-based method, VADER may not fully capture sarcasm, contrastive clauses, domain-specific idioms, or subtle contextual shifts in hotel reviews. Future research should validate sentence-level sentiment scores against transformer-based sentiment classifiers, such as BERT, RoBERTa, DistilBERT, or GPT-based approaches, and ideally compare automated sentiment scores with human-coded judgments (Kim 2025; Kim et al., 2026). Recent consumer-review research also suggests that sentiment measures can be evaluated not only by classification performance but also by their predictive validity in downstream marketing models (Devlin et al., 2019; Liu et al., 2019; Sanh et al., 2019; Kim et al., 2025).
Fifth, the frequency count variable was operationalized as the number of sentences assigned to each service attribute within a review. Although this measure is more precise than a simple keyword count, longer reviews may mechanically contain more attribute mentions. To partially address this issue, Model 3 also controlled for review length and review-year fixed effects, and several frequency-related patterns remained meaningful after these controls were included. Nevertheless, the count variable should still be interpreted as an indicator of attribute salience rather than as a fully normalized measure of attribute importance. Prior studies show that review length, depth, and textual characteristics can shape review helpfulness and other outcomes, underscoring the need to account for textual volume when interpreting review-derived variables (Mudambi and Schuff, 2010; Ghose and Ipeirotis, 2011). Future research could further refine this measure by using normalized attribute-share indicators or by comparing sentence-count measures with word-count-based and proportion-based alternatives.
Finally, this study relies on observational review data and uses ordinal satisfaction ratings as the primary outcome. Therefore, the estimated coefficients should be interpreted as conditional statistical effects rather than causal effects. Although the robustness specification includes review-year fixed effects, unobserved factors such as traveler purpose, trip type, seasonality, service recovery experiences, and broader temporal shocks may still influence review ratings. In particular, the COVID-19 period represents an important contextual shock for the travel and hospitality industry, but year fixed effects alone cannot identify how such disruptions changed traveler expectations, service operations, or review behavior. Future research could address these issues using richer metadata, more granular temporal information, and, where appropriate, panel, quasi-experimental, or pandemic-period research designs. Future studies could also link sentence-level attribute sentiment and frequency to behavioral or market outcomes, such as booking intentions, repeat visits, review helpfulness, digital word-of-mouth, or hotel performance. Presenting predicted probabilities or marginal effects by brand tier would also make the findings more intuitive for managerial interpretation (Kim et al., 2026).
Overall, this study demonstrates the value of integrating sentence-level review analytics with multilevel modeling and highlights the need for ongoing validation of text-derived constructs. Future work using human-referenced validation, transformer- and LLM-based classification, normalized salience measures, and richer contextual data would further strengthen review-based research on service attributes.
Author Biographies
∙ Da Yeon Kim is a Visiting Professor of Marketing at Dongguk Business School, Dongguk University. She earned dual degrees, a B.F.A. and a B.B.A., from Chonnam National University; an M.S. in Business Administration from Hongik University; and a Ph.D. in Business Administration (Marketing) from Korea University. She also conducted cultural policy and industry research at public institutions under the Ministry of Culture, Sports and Tourism. Her primary research interests include marketing analytics, AI and digital marketing, customer value, and arts and cultural marketing. Her research leverages advanced AI, machine learning, and multimodal analytics to analyze customer-generated content, extract customer value, and predict marketing performance to generate strategic insights.
∙ Hae Jin Seo is an Assistant Professor of Marketing in the Division of Business Administration at Pukyong National University. She received her B.B.A., M.B.A., and Ph.D. in Business Administration from Pusan National University. Her research interests include sustainability management, business analytics, customer lifetime value, customer equity, and marketing communication strategies. She integrates traditional marketing research methods with generative AI–based approaches to analyze a wide range of marketing phenomena and studies consumer responses to marketing communications and firms' strategic activities.
∙ Tae-Ho Song is a Professor of Marketing at the School of Business and the Director of the Institute of Management Research at Pusan National University. He earned a B.S. in Computer Science from KAIST and received an M.S. and a Ph.D. in Business Administration (Marketing) from Korea University. He subsequently conducted postdoctoral research at UCLA. His primary research interests include AI marketing, AI-based marketing analytics, and generative AI-based analytics for customer value and relationship management. His research encompasses transformer-based text and sentiment analysis using models such as BERT; advertising strategies based on large language models and generative AI; consumer evaluation analysis using explainable AI; customer experience and online word-of-mouth on digital platforms; multimodal data analytics; customer value measurement; and marketing performance analytics.