
.jpeg)
Stakeholder Orientation and Dividend Smoothing: Evidence from Stakeholder Constituency Statutes
* 서울대학교 경영대학 경영학과 (College of Business Administration, Seoul National University)
*교신저자: 이용규 (qvian@snu.ac.kr)
DOI: https://doi.org/10.17287/kmr.2026.55.2.815
Abstract
This paper examines how stakeholder orientation, defined as the legal flexibility granted to corporate directors to consider the interests of non-shareholder groups, affects firms’ dividend smoothing practices. While incorporating broader stakeholder interests may enhance trust and reduce reliance on signaling mechanisms such as stable dividend payouts, it may also dilute shareholder oversight and increase managerial discretion. Exploiting the staggered adoption of stakeholder constituency statutes across U.S. states as a quasi-natural experiment, we find that affected firms reduce the degree of dividend smoothing. This effect is more pronounced among consumer-oriented, labor-intensive, and low-liquidation-value firms, where stakeholder interests are particularly salient and conflicts between shareholders and stakeholders are more severe. The effect is also stronger among firms with higher cash holdings and free cash flow, where agency costs are likely to be greater. Overall, our findings suggest that expanding directors’ fiduciary scope beyond shareholders can meaningfully influence corporate payout policies.
Ⅰ. Introduction
The distinction between prioritizing shareholders and considering broader stakeholder interests has drawn growing interest in both academia and corporate discussions. A shareholder-oriented view maintains that a firm’s main duty is to enhance shareholder value, treating the firm as primarily profit-focused (Sundaram and Inkpen, 2004; Friedman, 2007). Conversely, the stakeholder perspective emphasizes that firms bear ethical obligations beyond shareholders, suggesting that managers should aim to generate shared value by taking into account the needs of multiple stakeholder groups such as employees, customers, suppliers, and the wider community, when making strategic choices (Donaldson and Preston, 1995; Jones, 1995; Freeman et al., 2007; Freeman, 2010).
Dividend smoothing, first systematically analyzed by Lintner (1956), refers to the practice by which firms strive to maintain stable and predictable dividend payouts over time. Rather than recalculating dividends as entirely new each period, managers typically evaluate if incremental adjustments to existing dividends are justified. From an agency perspective, this practice acts as a commitment device that limits managers’ discretionary cash flow and curbs opportunistic behavior (Easterbrook, 1984, Jensen, 1986, Leary and Michaely, 2011). Stable payouts enforce managerial discipline and expose the firm to external market scrutiny when new financing is required, which helps reduce agency costs. Consistent dividends also attract institutional investors who value predictable income and closely monitor management, and because they react strongly to dividend cuts, their presence further discourages erratic payout behavior. Therefore, by committing to stable dividend payouts, managers reduce their discretion over the use of free cash flow, which may help alleviate investor concerns regarding potential opportunistic behavior.
Given the role of dividend smoothing in addressing agency concerns, investigating how stakeholder orientation influences this managerial practice becomes particularly relevant. Stakeholder orientation grants directors legal and ethical flexibility to prioritize the interests of non-shareholder groups, which may influence the credibility and commitment signaled by consistent dividend policies. Thus, investigating the relation between stakeholder orientation and dividend smoothing is crucial for understanding how broader ethical and legal responsibilities assigned to managers influence their decisions regarding dividend policy. In this study, we seek to address this gap by explicitly investigating whether firms adopting a stakeholder-oriented approach are more or less inclined to smooth dividends, shedding light on how commitments to various stakeholders may alter traditional dividend strategies aimed primarily at shareholders.
The relation between stakeholder orientation and dividend smoothing involves competing theoretical perspectives based on agency theory. On one hand, stakeholder orientation, which encourages managers to consider broader non-shareholder interests, may promote more disciplined and accountable managerial behavior. As a result, the role of dividend smoothing in mitigating agency conflicts may diminish, since managerial discretion over free cash flow is already constrained through heightened ethical expectations and stakeholder considerations. On the other hand, stakeholder orientation may increase agency concerns from the perspective of shareholders by expanding managerial discretion over the use of free cash flow. Even in the presence of shareholder oversight and external monitoring, managers may justify reallocating resources toward non-shareholder constituencies, which could deviate from shareholder interests. In response, managers may retain or even reinforce dividend smoothing to reassure investors of their continued financial discipline and commitment to shareholder value.
To examine the impact of stakeholder orientation on dividend smoothing, we exploit variation from the staggered enactment of stakeholder constituency statutes across 35 U.S. states (1984–2007), which offers a plausibly exogenous setting for identification. Drawing on empirical strategies developed in earlier work (e.g., Flammer and Kacperczyk, 2016; Leung et al. 2019; Liu et al., 2019; Ni, 2020; Ni et al., 2020; Chowdhury et al., 2021; Gao et al., 2021; Chen et al., 2023; Romec, 2023; Garman and Kubick, 2024; Radhakrishnan et al., 2025), we apply a staggered difference-in-differences (DiD) framework. The passage of stakeholder constituency statutes provides a valid empirical setting for causal inference for several reasons. First, the statutes expand the scope of considerations that directors are legally permitted to take into account, reflecting a shift from a shareholder-exclusive framework to one that formally incorporates the interests of multiple stakeholder groups. Second, although these statutes were primarily intended to broaden the legal scope of directors’ responsibilities to stakeholders, they were not explicitly designed to influence financial policies at the firm level, such as dividend decisions. Third, the staggered timing and state-level variation in the adoption of these statutes introduces both cross-sectional and time-series variation in firms’ stakeholder orientation, enabling identification of its impact on dividend behavior (Flammer and Kacperczyk, 2016).
Using a large sample of 38,162 firm-year observations covering the years 1980–2015, we examine the competing theoretical predictions regarding the impact of stakeholder orientation on dividend smoothing. Consistent with prior literature (e.g., Brockman et al., 2022), we proxy dividend smoothing using the speed of adjustment (SOA), where a lower SOA indicates a higher degree of smoothing. Our baseline analysis reveals that firms tend to reduce the extent of dividend smoothing following the adoption of stakeholder constituency statutes. To mitigate concerns related to reverse causality, we verify the parallel trends assumption and show that the observed reduction in smoothing occurs only after the statutory changes take effect. In addition, we demonstrate that the results are robust to a variety of empirical checks, including controls for concurrent legal reforms, exclusion of potentially endogenous statute adoptions, and alternative model specifications. Taken together, the results indicate that when managers are legally permitted to consider broader stakeholder interests, they become less inclined to engage in dividend smoothing. This finding is consistent with the view that stakeholder orientation alleviates agency concerns by reducing the need for dividend smoothing as a disciplinary mechanism. When managers are legally permitted to consider broader stakeholder interests, their discretion over free cash flow becomes less threatening from shareholders’ perspective, weakening the role of smoothing as a commitment device.
We conduct several cross-sectional tests. First, we explore whether the effect of stakeholder constituency statutes on dividend smoothing is more pronounced under firm characteristics that amplify the salience of stakeholder interests and conflicts between shareholders and stakeholders. Specifically, we predict stronger effects in (1) consumer-focused industries, where firms are more exposed to reputational pressures and direct stakeholder scrutiny; (2) labor-intensive firms, where employee-related concerns are central to operations; and (3) firms with lower liquidation value, where shareholder dominance is more likely in the absence of formal stakeholder protections. In such settings, the adoption of stakeholder constituency statutes provides stronger legal and institutional support for managers to incorporate stakeholder interests into decision-making, thereby inducing more noticeable shifts in financial policies such as dividend smoothing. Consistent with these predictions, our empirical analysis shows that the reduction in dividend smoothing following stakeholder constituency statutes adoption is indeed more pronounced among firms with these characteristics.
Second, we examine whether the effect of stakeholder constituency statutes varies with firms’ agency costs. When managers have greater access to discretionary internal funds, opportunities for opportunistic behavior increase and payout smoothing becomes more sensitive to governance constraints. Accordingly, if stakeholder constituency statutes serve as a governance mechanism, their effect should be stronger among firms with higher agency costs. Using cash holdings and free cash flow as proxies for agency costs, we find evidence consistent with this prediction.
Finally, we conduct a supplementary analysis to examine whether the reduction in dividend smoothing associated with stakeholder orientation affects firm value. We find that dividend smoothing does not have a direct effect on firm value, regardless of whether firms are incorporated in states that have adopted stakeholder constituency statutes. This result is consistent with Larkin et al. (2017), who, using U.S. data, show that smoother dividend paths, while sometimes preferred by investors, do not necessarily translate into higher valuations.
We make several contributions to the literature. First, this study extends the literature on dividend smoothing by investigating the role of stakeholder constituency statutes as a legal mechanism influencing managerial payout decisions. While prior research has largely focused on firm-level determinants of smoothing behavior (e.g., Lintner, 1956; Leary and Michaely, 2011), this study investigates whether formal statutory changes that expand directors’ permissible considerations beyond shareholder interests alter firms’ dividend practices. The findings indicate that the legal recognition of stakeholder interests is associated with a reduction in dividend smoothing, suggesting a shift in managerial incentives under a stakeholder-oriented legal regime.
Second, this research complements prior work on stakeholder orientation by highlighting its implications for financial policy, an area that has received limited attention. Whereas existing studies have focused on innovation, employee relations, or earnings credibility (e.g., Ni, 2020; Radhakrishnan et al., 2025), this study investigates dividend smoothing, which is a core financial decision linked to investor expectations and managerial discretion. This approach introduces a distinct outcome through which stakeholder-oriented statutes may affect firm behavior. A notable exception is Ni et al. (2020), who find that stakeholder-oriented statutes have no significant effect on dividend payments. As the determinants of dividend smoothing differ from those of dividend levels (Leary and Michaely, 2011), statutes may still affect smoothing practices even when average payout levels remain unchanged. Moreover, offsetting dividend increases and decreases leave average payments unaffected but can alter smoothing. Our findings offer insight into this perspective.
Third, the study contributes to understanding the relation between stakeholder orientation and agency dynamics. Theoretical perspectives provide contrasting expectations: stakeholder statutes may mitigate agency problems by reinforcing ethical standards and broader accountability, or they may intensify them by increasing managerial discretion and weakening shareholder oversight. By analyzing how changes in smoothing behavior vary by firm characteristics, such as consumer orientation, labor intensity, and asset liquidation value, the study offers empirical evidence that informs this theoretical debate.
This paper proceeds as follows. Section 2 outlines the institutional context and hypothesis formulation. Section 3 presents the data and research methodology. Section 4 discusses the empirical findings, and Section 5 concludes.
Ⅱ. Background, prior literature and hypothesis development
2.1 Institutional background
Stakeholder constituency statutes were introduced in response to ongoing discussions in corporate law and finance over the extent to which firms should serve broader societal interests beyond shareholders (e.g., Bainbridge, 1991; Orts, 1992). This discourse can be traced back to the early 20th century, particularly to Dodd’s (1931) influential argument that corporations ought to fulfill public responsibilities and not focus solely on maximizing shareholder wealth. In contrast, many economists and legal scholars maintain that shareholder primacy is essential for effective corporate control, arguing that the interests of other stakeholders are already protected through existing legal contracts and regulatory frameworks (Tirole, 2001; Bénabou and Tirole, 2010).
This ideological divide regained prominence in the 1980s as stakeholder theory gained traction and U.S. states began to adopt statutes allowing corporate directors to explicitly consider non-shareholder constituencies. These statutes were introduced during an era of heightened takeover activity and were intended, in part, to provide boards with legal cover to resist hostile bids (Karpoff and Wittry, 2018). While stakeholder constituency statutes do not prescribe a specific hierarchy among stakeholder interests, they permit directors to legally consider employees, customers, and other groups when making decisions, even when such considerations may not align with the goal of maximizing shareholder value in the short term (Bainbridge, 1991; Lee, 2022).
As of 2007, 35 U.S. states had implemented stakeholder constituency statutes. In line with Flammer and Kacperczyk (2016), we provide a summary of the adoption timeline and identify the corresponding firms affected, as shown in Table 2. These legal reforms offer a unique empirical setting for identifying shifts in corporate priorities, as they alter the legal basis of boardroom decision-making by broadening the range of interest directors may consider. Importantly, the enactment of these statutes is determined at the state level and is exogenous to any individual firm’s corporate strategy, allowing us to treat their adoption as plausibly exogenous variation in stakeholder orientation.
While stakeholder-oriented strategies have been associated with long-term advantages, such as greater innovation and improved employee involvement (e.g., Flammer and Kacperczyk, 2016; Chowdhury et al., 2021), they may not always receive full support from shareholders. Ni (2020) emphasizes that shareholders might resist stakeholder-focused reforms due to concerns over short-term financial sacrifices, such as reduced dividend payouts or lower accounting transparency. This skepticism is rooted in the perception that directors could invoke stakeholder claims to justify decisions that dilute shareholder value1.
Survey evidence also indicates that corporate directors themselves often view their roles as encompassing responsibilities to a broad range of constituents. For example, Wang and Dewhirst (1992) find that directors of large U.S. public firms acknowledge the importance of addressing stakeholder concerns in their governance roles. Taken together, these findings suggest that although stakeholder constituency statutes do not impose mandatory duties beyond shareholders, their permissive nature can meaningfully reshape managerial priorities and serve as a legal foundation for moving away from exclusive shareholder primacy (Flammer and Kacperczyk, 2016).
2.2 Prior literature and hypothesis development
Dividend smoothing, defined as the practice of maintaining stable and predictable dividend payouts despite earnings fluctuations, has long been viewed as a central feature of corporate financial policy since Lintner’s (1956) foundational work. Among the various theories proposed to explain this phenomenon, the agency-based perspective has gained prominence for its emphasis on the role of dividend policy in mitigating managerial discretion and aligning the interests of managers and shareholders2.
From the agency perspective, smoothing dividends can function as a commitment device that restricts the availability of free cash flow under managerial control, thereby reducing the scope for opportunistic behavior. By maintaining a stable payout level, managers impose self-discipline and subject the firm to the scrutiny of external capital markets, especially when additional financing is needed (Easterbrook, 1984; Jensen, 1986). Regular scrutiny from external financial markets serves as a powerful check on managerial behavior, ultimately curbing agency costs (Leary and Michaely, 2011). In addition, Allen et al. (2000) and Shin and Kim (2014) document that consistent dividend payouts can enhance a firm’s appeal to institutional investors, who value predictable income streams and actively engage in monitoring management. These investors are sensitive to dividend cuts and can impose significant reputational and financial penalties, encouraging managers to avoid erratic dividend behavior.
Recent studies provide empirical support for this view. For example, Leary and Michaely (2011) find that firms facing greater external scrutiny, such as those with higher analyst coverage, lower earnings volatility, and larger firm size, are more likely to engage in dividend smoothing. Similarly, Javakhadze et al. (2014) show that companies operating in environments with weaker investor protection tend to smooth dividends more, suggesting that dividends can serve as informal governance mechanisms under such conditions. In a related context, Li et al. (2023) investigate the impact of China’s Green Credit Policy, which imposed tighter financing constraints and enhanced external monitoring on polluting firms. They find that firms subject to the policy experienced a significant reduction in dividend smoothing, indicating that increased external oversight, such as stricter credit regulation, can substitute for dividend smoothing in mitigating agency conflicts.
In this context, the enactment of stakeholder constituency statutes can alter the degree to which firms depend on dividend smoothing to address agency problems. By granting directors greater latitude to consider the interests of non-shareholder groups, such statutes may affect the perceived need for governance mechanisms, including stable dividend payouts. However, the direction of this influence remains theoretically ambiguous.
On one hand, stakeholder orientation can reduce agency concerns by encouraging managers to act with stronger ethical and social responsibility. According to the ethical perspective of stakeholder theory (Jones, 1995; Donaldson and Preston, 1995), companies that take into account the interests of a broad range of stakeholders, including shareholders and non-shareholder stakeholders, are more likely to behave ethically. This kind of ethical behavior helps build trust and long-term cooperation between the firm and its stakeholders, which can make the firm more stable over time. Although stakeholder orientation is not exactly the same as corporate social responsibility (CSR), it can still make managers more aware of the broader social impact of their decisions. When managers consider how their actions affect employees, customers, and the community, they may place greater value on acting responsibly and ethically. Prior evidence suggests that higher ethical standards enhance the credibility of managerial actions and reduce concerns about opportunistic behavior (Kim et al., 2025). As a result, shareholders may become less concerned about potential misuse of free cash flow, which lowers the need for dividend smoothing as a way to control managerial behavior (Ni, 2020; Chowdhury et al., 2021; Gao et al., 2021).
Based on this mechanism, our first hypothesis is as follows:
Hypothesis 1a (H1a): Stakeholder orientation reduces firms’ dividend smoothing practices.
On the other hand, giving more attention to stakeholder interests could create more chances for managers to act in their own self-interest. For example, they might misuse company resources or make deals that benefit employees or other non-shareholder groups instead of shareholders. From this perspective, stakeholder orientation may raise concerns that managers could collude with non-shareholder stakeholders, such as suppliers or employees, to use corporate resources in ways that benefit those parties rather than shareholders (Bertrand and Mullainathan, 2003; Pagano and Volpin, 2005). Shareholders may worry that such collusion allows managers to divert free cash flow toward stakeholder interests under the guise of stakeholder engagement. In response to these concerns, managers might smooth dividends more actively to reassure investors that they remain committed to disciplined financial practices and the protection of shareholder value.
This alternative mechanism leads to the following hypothesis:
Hypothesis 1b (H1b): Stakeholder orientation increases firms’ dividend smoothing practices.
III. Variable measurement, research design, and sample selection
3.1 Measurement of dividend smoothing
Following prior literature (e.g., Leary and Michaely, 2011; Brockman et al., 2022), we construct two measures of dividend smoothing. Both measures rely on the speed of adjustment, estimated through a two-stage procedure, and differ only in the length of the estimation window used to construct the smoothing variable. In the first stage, we compute a firm’s target payout ratio ($TPR_i$) using a rolling window approach. Specifically, we calculate the median of the firm’s historical payout ratios over a trailing 5-year or 10-year window ending in year $t$, requiring at least three or seven valid observations and a minimum of one positive dividend payout for each calculation period. We define the payout ratio as the proportion of dividends to income before extraordinary items. We then calculate the deviation between this target and the actual payout in year $t$, denoted as $dev_{i,t}$.
In the second stage, we again rely on a rolling window regression to estimate the adjustment coefficient $\beta$ by regressing changes in dividends per share ($\Delta DPS$) on the deviations ($dev_{i,t}$) from the target payout ratio.3
We calculate dividends per share ($DPS$) as total dividends divided by the number of common shares outstanding, and earnings per share ($EPS$) as income before extraordinary items divided by the same denominator. Both $DPS$ and $EPS$ are adjusted for stock splits using the appropriate adjustment factors. The speed of adjustment, denoted as $SOA5$ or $SOA10$, reflects a firm’s responsiveness to past deviations, based on a trailing 5-year or 10-year window, respectively. Lower values of $SOA5$ or $SOA10$ indicate stronger dividend smoothing behavior.4 To mitigate the influence of outliers, we truncate the distribution of the speed of adjustment estimates at the 2.5 and 97.5 percentiles. This approach ensures comparability with prior studies (e.g., Leary and Michaely, 2011; Larkin et al., 2017; Brockman et al., 2022) that adopt the same cutoffs.5
3.2 Research design
To test the impact of stakeholder orientation on dividend smoothing, we rely on prior studies and estimate the following difference-in-differences model:
where we use the speed of adjustment (denoted as SOA5 or SOA10) as the dependent variable. We define CS as an indicator for stakeholder orientation, taking the value of one for firm-years in which the state of incorporation has adopted stakeholder constituency statutes, and zero otherwise.
To isolate the effect of stakeholder orientation, we follow prior studies (e.g., Leary and Michaely, 2011; Larkin et al., 2017) and control for a wide range of firm-level attributes that could independently affect dividend smoothing. Firm size (SIZE), sales growth (GROWTH), and profitability (ROA) capture a firm’s financial capacity and growth opportunities, while firm age (AGE) and the frequency of reported losses (PER_LOSS) reflect organizational maturity and historical performance consistency. The book-to-market ratio (BM) and leverage (LEV) account for firm valuation and financial risk, respectively, which can affect dividend policy through capital market discipline. We also control for earnings volatility (EARN_VOL) and cash holdings (CASH) to capture uncertainty and liquidity, which are directly related to a firm’s ability and need to smooth dividends. R&D intensity (RD) and capital expenditures (DCPX) proxy for internal investment demands that may compete with dividend payouts. Lastly, we include dividend yield (DVY), share turnover (TURNOVER), and analyst following (AF) to reflect the firm’s capital market environment and the degree of external monitoring. In addition, we control for unobserved heterogeneity by including firm fixed effect ($f_i$) fiscal year fixed effects ($r_t$) and state of headquarter location fixed effects ($\gamma_s$). The fixed effects help account for time-invariant firm characteristics, aggregate year-specific shocks, and persistent differences across states, respectively. Since stakeholder orientation is determined at the incorporation-state level, we cluster standard errors accordingly. This accounts for within-state serial correlation in unobserved factors that may jointly influence firms’ dividend behavior over time (Bertrand and Mullainathan, 2003; Bertrand et al., 2004).
3.3 Sample selection
Table 1 summarizes the sample selection procedure. Our sample covers the years 1980 through 2015. Financial and stock return data are sourced from Compustat and CRSP. We begin the sample in 1980 to allow for sufficient pre-treatment coverage before the initial adoption of stakeholder constituency statutes in 1984.6 The end year, 2015, ensures that the statute is effectively binding for all adopting states, including Texas, where the law’s applicability was delayed.7 In line with previous studies, we drop firms classified under the financial (SIC 6000–6999) and utility (SIC 4910–4939) sectors, which are subject to distinct regulatory frameworks. In addition, we eliminate observations with incomplete data on key variables. The final sample comprises 38,162 firm-year observations.
Table 1 Sample selection
| Sample selection | # of obs |
|---|---|
| All firm-year observations from Compustat during 1980-2015 | 379,364 |
| Less: | |
| Observations in financial and utility industries | (105,578) |
| Observations without data available for calculating dividend smoothing measures | (211,693) |
| Observations with missing data on firm-level control variables | (23,931) |
| Final sample | 38,162 |
Ⅳ. Empirical results
4.1 Descriptive statistics and correlations
Table 2 summarizes the adoption of stakeholder constituency statutes across 35 U.S. states, indicating the enactment year and the number of firms affected in each state. The adoption timeline extends from Ohio in 1984, the earliest adopter, to Nebraska in 2007, the last state to implement. States like Ohio (1984) and Arizona (1987) represent the earliest wave of statutory reform, signaling a shift toward broader corporate accountability beyond shareholder interests.
Table 2 State-level enactment of stakeholder constituency statutes
| State of incorporation | Adoption year | # of affected firms |
|---|---|---|
| Ohio | 1984 | 67 |
| Illinois | 1985 | 9 |
| Maine | 1986 | 6 |
| Arizona | 1987 | 2 |
| Minnesota | 1987 | 24 |
| New York | 1987 | 81 |
| Wisconsin | 1987 | 24 |
| Louisiana | 1988 | 4 |
| Tennessee | 1988 | 8 |
| Virginia | 1988 | 30 |
| Florida | 1989 | 26 |
| Georgia | 1989 | 23 |
| Hawaii | 1989 | 1 |
| Indiana | 1989 | 19 |
| Iowa | 1989 | 4 |
| Massachusetts | 1989 | 23 |
| Missouri | 1989 | 11 |
| New Jersey | 1989 | 25 |
| Oregon | 1989 | 7 |
| Mississippi | 1990 | 2 |
| Pennsylvania | 1990 | 47 |
| Rhode Island | 1990 | 2 |
| South Dakota | 1990 | 1 |
| Wyoming | 1990 | 1 |
| Nevada | 1991 | 18 |
| North Carolina | 1993 | 14 |
| Connecticut | 1997 | 11 |
| Maryland | 1999 | 17 |
| Texas | 2006 | 15 |
| Nebraska | 2007 | 2 |
Several states are excluded from the table because no firms in the final sample were affected by their adoption of stakeholder constituency statutes. These states include New Mexico (1987), Idaho (1988), Kentucky (1989), North Dakota (1993), and Vermont (1998).
A notable clustering of adoptions occurred during the late 1980s and early 1990s, with states such as New York (1987), Ohio (1984), and Pennsylvania (1990) enacting these statutes and covering 81, 67, and 47 firms, respectively. Conversely, several states, including New Mexico (1987), Idaho (1988), Kentucky (1989), North Dakota (1993), and Vermont (1998), report no affected firms in the sample, likely due to minimal incorporation activity or limited application of the statutes within those jurisdictions.
Panel A of Table 3 reports summary statistics for the key variables employed in the analysis. We apply winsorization at the 1st and 99th percentiles to all continuous accounting variables to limit the effect of outliers. The average values of the dividend smoothing measures are 0.243 for SOA5 and 0.224 for SOA10, respectively. The mean value of CS is 0.279, suggesting that about 28% of observations correspond to firms operating under stakeholder constituency statutes, consistent with previous research (e.g., Ni, 2020). Panel B of Table 3 reports pairwise Pearson correlations among the variables. As anticipated, SOA5 and SOA10 are positively correlated, reflecting consistency between the two measures. Additionally, the generally low correlations across explanatory variables suggest that multicollinearity is unlikely to pose a major issue in the multivariate analysis.
Table 3 Descriptive statistics and correlations — Panel A: Descriptive statistics
| Variable | N | Mean | SD | p25 | Median | p75 |
|---|---|---|---|---|---|---|
| SOA5 | 38,162 | 0.243 | 0.351 | 0.000 | 0.106 | 0.373 |
| SOA10 | 32,964 | 0.224 | 0.276 | 0.029 | 0.132 | 0.324 |
| CS | 38,162 | 0.279 | 0.449 | 0.000 | 0.000 | 1.000 |
| SIZE | 38,162 | 6.329 | 2.006 | 4.878 | 6.270 | 7.729 |
| GROWTH | 38,162 | 0.083 | 0.195 | -0.010 | 0.067 | 0.154 |
| ROA | 38,162 | 0.061 | 0.070 | 0.025 | 0.058 | 0.097 |
| AGE | 38,162 | 2.919 | 0.519 | 2.565 | 2.944 | 3.332 |
| PER_LOSS | 38,162 | 0.105 | 0.188 | 0.000 | 0.000 | 0.200 |
| BM | 38,162 | 1.560 | 2.571 | 0.407 | 0.771 | 1.528 |
| LEV | 38,162 | 0.297 | 0.240 | 0.087 | 0.276 | 0.447 |
| EARN_VOL | 38,162 | 1.534 | 5.235 | 0.151 | 0.377 | 0.955 |
| CASH | 38,162 | 0.103 | 0.121 | 0.019 | 0.057 | 0.140 |
| RD | 38,162 | 0.015 | 0.029 | 0.000 | 0.000 | 0.019 |
| DCPX | 38,162 | 0.064 | 0.053 | 0.027 | 0.049 | 0.084 |
| DVY | 38,162 | 0.056 | 0.108 | 0.007 | 0.024 | 0.054 |
| TURNOVER | 38,162 | 0.090 | 0.098 | 0.028 | 0.055 | 0.111 |
| AF | 38,162 | 5.443 | 8.765 | 0.000 | 0.000 | 8.000 |
Table 3 Descriptive statistics and correlations (continued) — Panel B: Pearson correlations
| Variable | [1] | [2] | [3] | [4] | [5] | [6] | [7] | [8] | [9] | [10] | [11] | [12] | [13] | [14] | [15] | [16] |
|---|---|---|---|---|---|---|---|---|---|---|---|---|---|---|---|---|
| [1] | 1.000 | |||||||||||||||
| [2] | 0.196* | 1.000 | ||||||||||||||
| [3] | -0.013* | -0.009 | 1.000 | |||||||||||||
| [4] | -0.127* | -0.068* | -0.012* | 1.000 | ||||||||||||
| [5] | 0.054* | 0.014* | -0.025* | 0.001 | 1.000 | |||||||||||
| [6] | 0.126* | 0.031* | 0.013* | -0.013* | 0.306* | 1.000 | ||||||||||
| [7] | -0.222* | -0.090* | 0.226* | 0.337* | -0.111* | -0.029* | 1.000 | |||||||||
| [8] | 0.022* | 0.029* | -0.014* | -0.101* | -0.102* | -0.464* | 0.009 | 1.000 | ||||||||
| [9] | -0.016* | -0.009 | -0.095* | -0.123* | -0.017* | -0.044* | -0.160* | -0.049* | 1.000 | |||||||
| [10] | -0.059* | -0.023* | -0.077* | 0.327* | 0.020* | -0.316* | 0.010 | 0.184* | -0.077* | 1.000 | ||||||
| [11] | -0.013* | -0.004 | -0.051* | 0.042* | -0.017* | -0.121* | 0.004 | 0.110* | -0.111* | 0.088* | 1.000 | |||||
| [12] | 0.116* | 0.046* | 0.026* | -0.217* | -0.042* | 0.236* | -0.011* | 0.014* | -0.046* | -0.386* | -0.039* | 1.000 | ||||
| [13] | -0.018* | -0.005 | 0.035* | -0.030* | -0.022* | 0.057* | 0.032* | 0.027* | 0.006 | -0.203* | -0.034* | 0.182* | 1.000 | |||
| [14] | 0.010 | -0.009 | -0.098* | 0.019* | 0.116* | 0.112* | -0.161* | -0.118* | 0.040* | 0.056* | 0.008 | -0.185* | -0.081* | 1.000 | ||
| [15] | -0.037* | -0.012* | -0.102* | -0.009 | -0.029* | 0.051* | -0.135* | -0.140* | 0.765* | -0.043* | -0.099* | -0.047* | 0.020* | 0.060* | 1.000 | |
| [16] | 0.006 | 0.008 | 0.019* | 0.377* | 0.041* | 0.026* | 0.188* | 0.099* | -0.170* | 0.101* | 0.089* | 0.095* | 0.040* | -0.028* | -0.174* | 1.000 |
| [17] | -0.054* | -0.027* | 0.013* | 0.469* | 0.008 | 0.122* | 0.185* | -0.115* | -0.055* | 0.026* | -0.090* | -0.027* | 0.113* | 0.077* | 0.008 | 0.242* |
Panel A presents descriptive statistics for the full sample. Panel B reports Pearson correlations. [1] SOA5, [2] SOA10, [3] CS, [4] SIZE, [5] GROWTH, [6] ROA, [7] AGE, [8] PER_LOSS, [9] BM, [10] LEV, [11] EARN_VOL, [12] CASH, [13] RD, [14] DCPX, [15] DVY, [16] TURNOVER, [17] AF. * indicates significance at the 5% levels or lower. See Appendix A for variable definitions.
4.2 The impact of stakeholder orientation on dividend smoothing
Table 4 reports the results from our main regression model, as specified in Equation (2), which investigates the relation between the adoption of stakeholder constituency statutes (CS) and firms’ dividend smoothing behavior. Columns (1) and (2) present estimates using two alternative measures of the speed of adjustment (SOA5 and SOA10) as the dependent variables. In both specifications, the coefficients on CS are positive and statistically significant (coeff. = 0.027, t-stat. = 3.16 for SOA5; coeff. = 0.023, t-stat. = 2.49 for SOA10). Given that a higher SOA indicates less smoothing, these results suggest that firms incorporated in states with stakeholder constituency statutes are less likely to smooth dividends compared to firms in non-adopting states. The magnitude of the effect is also economically meaningful. For instance, the SOA5 coefficient of 0.027 implies an approximate 11.1% increase in the average speed of adjustment, indicating that the presence of stakeholder statutes is associated with a substantial reduction in dividend smoothing intensity.8
Table 4 The effect of constituency statute adoption on dividend smoothing
| Variable | (1) SOA5 | (2) SOA10 |
|---|---|---|
| CS | 0.027*** (3.16) | 0.023** (2.49) |
| SIZE | -0.042*** (-6.09) | -0.046*** (-6.83) |
| GROWTH | 0.009 (1.11) | 0.024*** (3.36) |
| ROA | 0.467*** (16.46) | 0.311*** (8.13) |
| AGE | -0.478*** (-29.75) | -0.493*** (-14.92) |
| PER_LOSS | 0.091*** (2.80) | 0.062*** (3.39) |
| BM | -0.002 (-1.23) | -0.002 (-1.35) |
| LEV | 0.002 (0.09) | -0.002 (-0.11) |
| EARN_VOL | 0.000 (0.21) | -0.000 (-0.67) |
| CASH | 0.061* (1.90) | 0.007 (0.21) |
| RD | -0.166 (-0.72) | -0.345 (-1.42) |
| DCPX | 0.144 (1.60) | 0.097* (1.82) |
| DVY | -0.225*** (-7.03) | -0.153*** (-4.87) |
| TURNOVER | -0.037 (-1.49) | -0.045 (-1.33) |
| AF | 0.000 (0.42) | 0.000 (0.81) |
| Observations | 38,162 | 32,964 |
| Adjusted R-squared | 0.295 | 0.408 |
| Firm FE | Yes | Yes |
| State FE | Yes | Yes |
| Year FE | Yes | Yes |
| Cluster by Incorporated State | Yes | Yes |
This table reports the results from a difference-in-differences regression examining the impact of stakeholder constituency statutes on firms’ dividend smoothing behavior. The dependent variable is the speed of adjustment (SOA5 and SOA10) toward target dividends. T-statistics are provided in parentheses. ***, **, * indicates significance at the 1%, 5% and 10% levels, respectively. See Appendix A for variable definitions.
With respect to the control variables, SIZE is negatively associated with the speed of adjustment, consistent with the notion that larger firms face less information asymmetry and thus have weaker incentives to smooth dividends. ROA is positively associated with the speed of adjustment, suggesting that more profitable firms tend to smooth dividends to a lesser extent. We also find that firm age (AGE) is negatively associated with the speed of adjustment. This result indicates that older firms smooth dividends more strongly, consistent with the notion that mature firms prioritize dividend stability as a means of maintaining their reputation and meeting long-term shareholder expectations. In contrast, firms with persistent losses (PER_LOSS) exhibit significantly less dividend smoothing. Firms under prolonged financial distress are less able to sustain stable dividend policies. Instead, they tend to adjust payouts more rapidly in response to earnings shortfalls. Our findings for the control variables are broadly consistent with the patterns documented in earlier studies (e.g., Leary and Michaely, 2011).9
Overall, the results reported in Table 4 indicate that the adoption of stakeholder constituency statutes is associated with a statistically and economically significant decline in dividend smoothing. This result is consistent with the hypothesis (H1a) that stakeholder orientation alters managerial incentives by mitigating agency concerns between shareholders and managers. When managers are granted broader discretion to consider stakeholder interests, the need to rely on dividend smoothing as a mechanism to reduce agency problems may diminish.
To investigate this, we estimate an event-study specification by replacing the CS indicator in Equation (2) with a series of leads and lags relative to the year of statute adoption: $CS^{-4}$, $CS^{-3}$, $CS^{-2}$, $CS^{-1}$, $CS^{0}$, $CS^{+1}$, $CS^{+2}$, $CS^{+3}$, $CS^{+4}$, $CS^{+5}$, and $CS^{6+}$. Each indicator captures whether a firm-year falls within a specific time window before or after the enactment of the statute in the firm’s state of incorporation. For instance, $CS^{-4}$ ($CS^{+1}$) equals one if the observation occurs four years before (one year after) the law’s adoption, and zero otherwise.
4.3 Dynamic effects
This section evaluates whether the parallel trends assumption holds and explores potential endogeneity issues, with a particular focus on the risk of reverse causality. Specifically, we examine whether changes in dividend smoothing precede the adoption of stakeholder constituency statutes. As reported in columns (1) and (2) of Table 5, we do not observe any statistically significant differences in the speed of adjustment (SOA5 and SOA10) during the pre-adoption years ($CS^{-4}$, $CS^{-3}$, $CS^{-2}$, and $CS^{-1}$), supporting the assumption of parallel trends. The effects emerge gradually after the statutory changes, with $CS^{+4}$, $CS^{+5}$ and $CS^{6+}$. These results indicate that the observed reduction in dividend smoothing follows, rather than precedes, the policy change, mitigating concerns about reverse causality.
Table 5 Timing analysis
| Variable | (1) SOA5 | (2) SOA10 |
|---|---|---|
| CS−4 | 0.002 (0.20) | 0.003 (0.29) |
| CS−3 | 0.004 (0.24) | 0.003 (0.32) |
| CS−2 | -0.005 (-0.31) | 0.002 (0.14) |
| CS−1 | -0.002 (-0.10) | 0.012 (0.90) |
| CS0 | 0.005 (0.27) | 0.010 (0.71) |
| CS+1 | 0.009 (0.60) | 0.020 (1.30) |
| CS+2 | 0.015 (0.79) | 0.017 (1.02) |
| CS+3 | 0.021 (1.16) | 0.021 (1.26) |
| CS+4 | 0.038** (2.03) | 0.027* (1.76) |
| CS+5 | 0.030* (1.81) | 0.022 (1.43) |
| CS6+ | 0.041*** (3.29) | 0.036** (2.66) |
| Controls | Yes | Yes |
| Observations | 38,162 | 32,964 |
| Adjusted R-squared | 0.296 | 0.408 |
| Firm FE | Yes | Yes |
| State FE | Yes | Yes |
| Year FE | Yes | Yes |
| Cluster by Incorporated State | Yes | Yes |
This table reports the results from regressions of dividend smoothing on lag and lead indicators of constituency statute adoption to assess potential pre-treatment differences. The dependent variable is the speed of adjustment (SOA5 and SOA10) toward target dividends. Control variables are suppressed for brevity. T-statistics are provided in parentheses. ***, **, * indicates significance at the 1%, 5% and 10% levels, respectively. See Appendix A for variable definitions.
Figure 1 presents the coefficients on the event-time indicators for both SOA5 and SOA10. The figure shows no significant pre-adoption differences and a gradual post-adoption increase, consistent with the parallel trends assumption and the regression results.
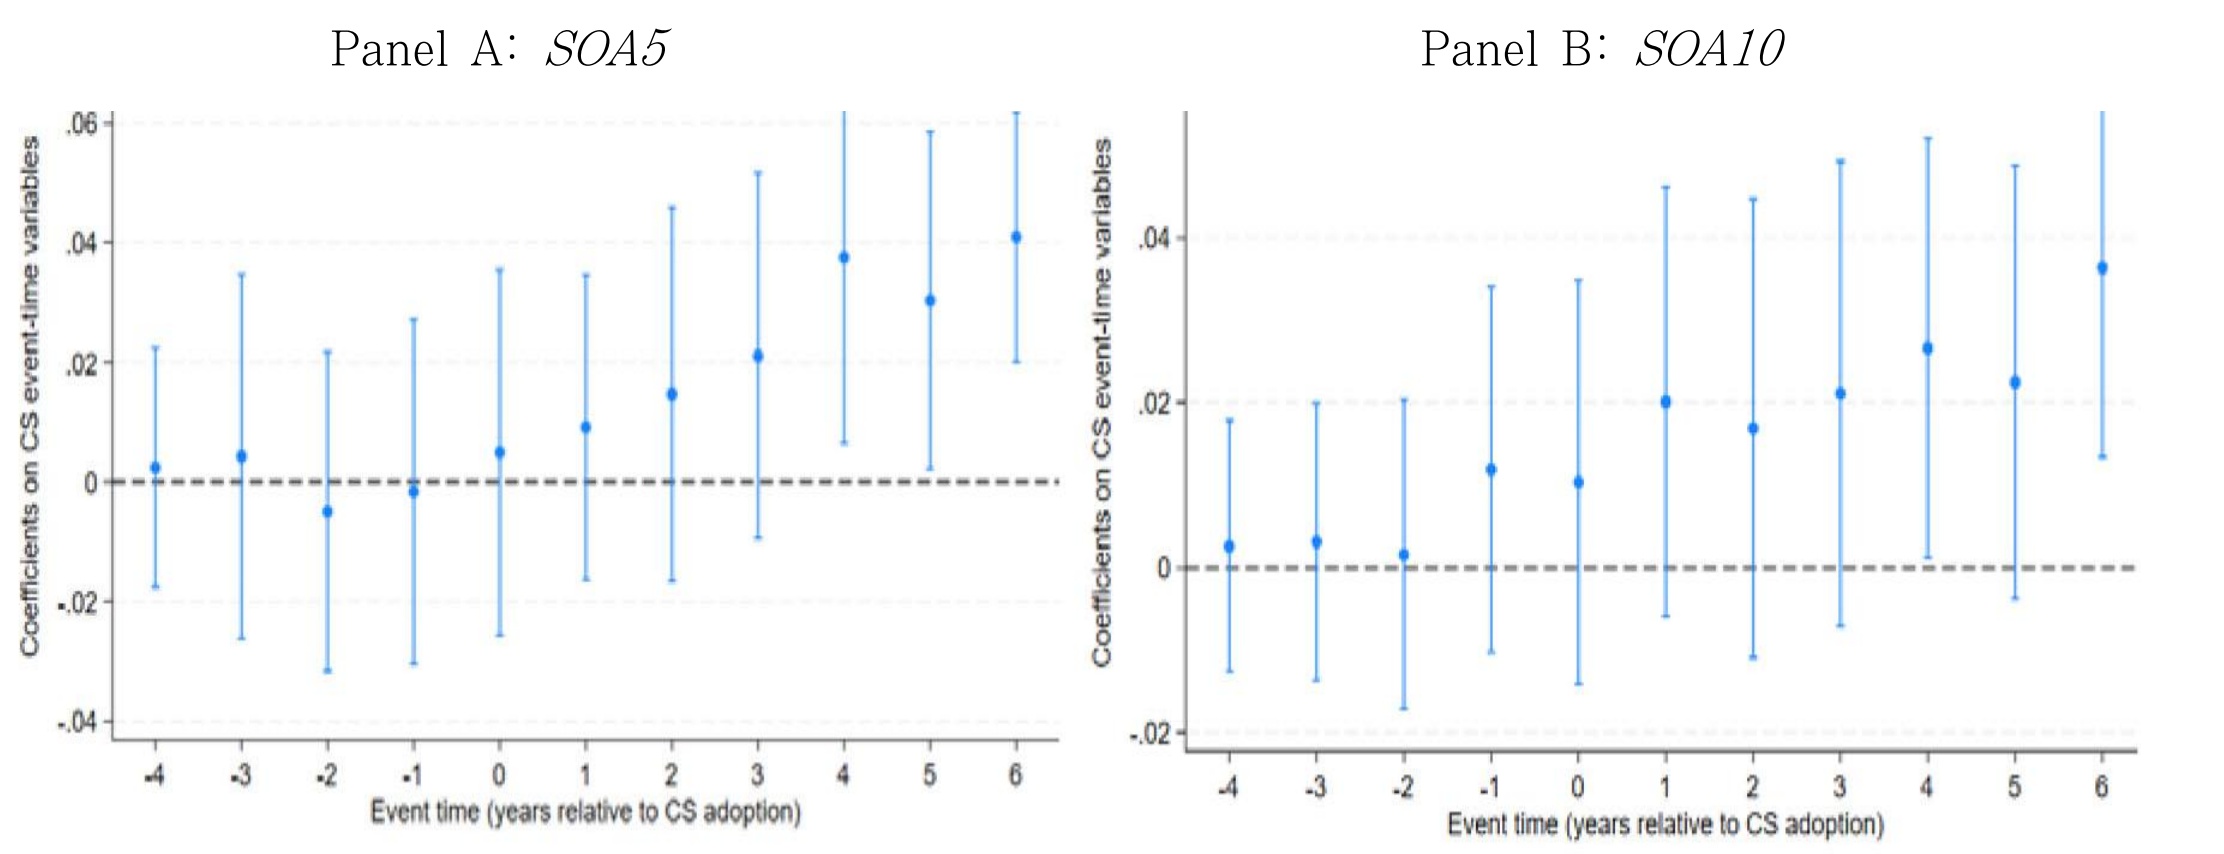
This figure plots the coefficients on the event-time indicators of constituency statute (CS) adoption for the years -4, -3, …, +5, and +6 and beyond, relative to the adoption year (i.e., year 0), for both SOA5 (Panel A) and SOA10 (Panel B). Vertical lines represent 90% confidence intervals, and the horizontal axis indicates event time.
4.4 Additional controls and subsamples
This section assesses the robustness of our baseline results by incorporating supplementary control variables and conducting subsample analyses. These additional tests serve to strengthen the empirical support for the hypothesis that the adoption of stakeholder constituency has implications for firms’ dividend smoothing behavior.
In Panel A of Table 6, we assess whether the observed effect of stakeholder constituency statutes on dividend smoothing is influenced by concurrent legal changes. To address this concern, we control for state-level antitakeover legislation by constructing a composite indicator (ANTI), which equals one if the state has implemented any of the four commonly studied antitakeover provisions, such as Control Share Acquisition, Business Combination, Fair Price, or Poison Pill laws, following Karpoff and Wittry (2018). Additionally, we include controls for other legal developments that may affect financial reporting. Specifically, we account for the Ninth Circuit Court’s 1999 decision (Huang et al., 2020) and the adoption of IDD statutes (Gao et al., 2018), both of which have been shown to influence earnings management. We find that the coefficient on CS remains significantly positive when the speed of adjustment is proxied by SOA5 in column (1) and by SOA10 in column (2), suggesting that the relation between stakeholder orientation and reduced dividend smoothing persists even after accounting for these potentially confounding regulatory factors.
Table 6 Additional controls and subsamples — Panel A: Controlling for confounding law changes
| Variable | (1) SOA5 | (2) SOA10 |
|---|---|---|
| CS | 0.028*** (3.11) | 0.022** (2.44) |
| ANTI | 0.003 (0.18) | -0.005 (-0.64) |
| NINTH | 0.008 (0.54) | -0.015 (-0.92) |
| IDD | -0.007 (-0.79) | -0.003 (-0.32) |
| Controls | Yes | Yes |
| Observations | 38,162 | 32,964 |
| Adjusted R-squared | 0.295 | 0.408 |
| Firm FE | Yes | Yes |
| Year FE | Yes | Yes |
| State FE | Yes | Yes |
| Cluster by Incorporated State | Yes | Yes |
Table 6 Panel B: Specific subsample tests
| Excluding states with restriction | Excluding lobbying states | Excluding Nebraska | ||||
|---|---|---|---|---|---|---|
| Variable | (1) SOA5 | (2) SOA10 | (3) SOA5 | (4) SOA10 | (5) SOA5 | (6) SOA10 |
| CS | 0.024** (2.71) | 0.023** (2.38) | 0.027*** (2.71) | 0.024** (2.17) | 0.026*** (3.03) | 0.022** (2.36) |
| Controls | Yes | Yes | Yes | Yes | Yes | Yes |
| Observations | 36,185 | 31,243 | 34,482 | 29,703 | 38,093 | 32,907 |
| Adjusted R-squared | 0.298 | 0.407 | 0.297 | 0.413 | 0.295 | 0.408 |
| Firm FE | Yes | Yes | Yes | Yes | Yes | Yes |
| Year FE | Yes | Yes | Yes | Yes | Yes | Yes |
| State FE | Yes | Yes | Yes | Yes | Yes | Yes |
| Cluster by Incorporated State | Yes | Yes | Yes | Yes | Yes | Yes |
Table 6 Panel C: Alternative subsample tests
| Excluding the adoption year | 0 ≤ SOA ≤ 1 | |||
|---|---|---|---|---|
| Variable | (1) SOA5 | (2) SOA10 | (3) SOA5 | (4) SOA10 |
| CS | 0.031*** (3.22) | 0.025*** (2.73) | 0.017** (2.11) | 0.017* (1.96) |
| Controls | Yes | Yes | Yes | Yes |
| Observations | 37,640 | 32,499 | 29,703 | 28,554 |
| Adjusted R-squared | 0.296 | 0.409 | 0.276 | 0.408 |
| Firm FE | Yes | Yes | Yes | Yes |
| Year FE | Yes | Yes | Yes | Yes |
| State FE | Yes | Yes | Yes | Yes |
| Cluster by Incorporated State | Yes | Yes | Yes | Yes |
In Panel A, we control for the potential influence of confounding legal changes (i.e., ANTI, NINTH, and IDD). In Panels B and C, we estimate equation (2) using various subsamples. T-statistics are provided in parentheses. ***, **, * indicates significance at the 1%, 5% and 10% levels, respectively. See Appendix A for variable definitions.
In Panel B, we evaluate the robustness of our baseline findings by focusing on specific subsamples. First, recognizing that 9 of the 35 states enacted stakeholder constituency statutes limited to takeover-related situations, we exclude firms incorporated in these states to ensure that our results are not solely driven by statutes applicable only during control changes.10 As shown in columns (1) and (2), the coefficient on CS remains positive and statistically significant, supporting the interpretation that the observed effect is not confined to takeover provisions. Second, following Karpoff and Wittry (2018), we account for the possibility that legislative changes were influenced by corporate lobbying in five states.11 After excluding firms incorporated in these states, columns (3) and (4) show that the coefficient on CS remains positive, consistent with the baseline results. Third, given Nebraska’s unique repeal and subsequent re-enactment of its constituency statute, we remove Nebraska-incorporated firms from the analysis. The results in columns (5) and (6) continue to show a positive and significant relation between the adoption of stakeholder constituency statutes and reduced dividend smoothing.
In Panel C, we conduct additional subsample tests to further assess the robustness of our main results. First, in columns (1) and (2), we follow the methodology of Basu and Liang (2019) by designating the year of statute adoption as a transition period. We exclude firm-year observations during these transition years to minimize potential biases stemming from partial implementation or uncertainty around legal changes. Second, in columns (3) and (4), we constrain the dependent variables SOA5 and SOA10 to fall within the range of 0 and 1, consistent with the empirical strategy of Leary and Michaely (2011), who recommend this trimming approach to reduce the influence of extreme values and improve the interpretability of the speed-of-adjustment measure. Across both tests, the coefficient on CS remains significantly positive, reaffirming the robustness of our baseline results.
4.5 Cross-sectional tests
4.5.1 Stakeholder salience and dividend smoothing
To further explore the underlying mechanisms linking stakeholder orientation to dividend smoothing, we conduct subsample analyses based on firm characteristics that heighten the salience of stakeholder interests: industry consumer orientation, labor intensity, and liquidation value. In addition to capturing contexts in which stakeholder interests are more salient, these three characteristics also reflect environments where potential conflicts between shareholders and non-shareholder stakeholders are more likely to arise. By examining variation along these dimensions, we assess whether the impact of stakeholder constituency statutes is amplified when stakeholders hold relatively weaker bargaining positions or when their interests conflict more directly with those of shareholders.
We begin by examining whether the observed reduction in dividend smoothing following the adoption of stakeholder constituency statutes is more pronounced among firms in industries where customer interests are particularly salient. Prior research suggests that stakeholder-oriented initiatives can strengthen a firm’s reputation and foster customer loyalty by signaling ethical behavior and social responsibility (Brown and Dacin, 1997; Luo and Bhattacharya, 2006; Porter and Kramer, 2006). These effects are likely to be more pronounced in industries that interact directly with end consumers, where reputational concerns are more salient. Flammer and Kacperczyk (2016) provide empirical support, showing that stakeholder orientation has stronger innovation effects in consumer-facing sectors. Based on this logic, we expect the effect of stakeholder constituency statutes adoption on dividend smoothing to be more pronounced in consumer-focused industries, where enhanced stakeholder legitimacy may reduce shareholder pressure and weaken the need for dividend smoothing as a tool to mitigate agency conflict.
To test this prediction, we construct a binary variable, CONSUMER, which equals one for firms operating in industries classified as “consumer goods,” and zero otherwise, following Lev et al. (2010)12. We then estimate our baseline model separately for firms in consumer-goods industries and firms outside these industries to assess whether the impact of stakeholder orientation varies across these industry segments. Panel A of Table 7 reports the results. In columns (1) and (3), we find that the coefficient on CS is significantly positive in the sample of consumer-oriented firms, while the coefficient is smaller and statistically insignificant for the firms in non-consumer-oriented industries. These findings suggest that the effect is concentrated among firms with greater exposure to consumer stakeholders.
Table 7 Cross-sectional analysis: Stakeholder salience — Panel A: Consumer-focused industries
| (1) | (2) | (3) | (4) | |
|---|---|---|---|---|
| CONSUMER | Yes | No | Yes | No |
| Variable | SOA5 | SOA5 | SOA10 | SOA10 |
| CS | 0.037** (2.26) | 0.020 (1.47) | 0.031** (2.03) | 0.008 (0.64) |
| Controls | Yes | Yes | Yes | Yes |
| Observations | 18,537 | 19,625 | 15,976 | 16,988 |
| Adjusted R-squared | 0.289 | 0.302 | 0.393 | 0.422 |
| Firm FE | Yes | Yes | Yes | Yes |
| State FE | Yes | Yes | Yes | Yes |
| Year FE | Yes | Yes | Yes | Yes |
| Cluster by Incorporated State | Yes | Yes | Yes | Yes |
Table 7 Panel B: Labor intensity
| (1) | (2) | (3) | (4) | |
|---|---|---|---|---|
| LABOR | High | Low | High | Low |
| Variable | SOA5 | SOA5 | SOA10 | SOA10 |
| CS | 0.031*** (3.06) | 0.016 (1.00) | 0.030* (1.69) | 0.011 (1.01) |
| Controls | Yes | Yes | Yes | Yes |
| Observations | 19,241 | 18,465 | 16,688 | 15,901 |
| Adjusted R-squared | 0.297 | 0.324 | 0.412 | 0.447 |
| Firm FE | Yes | Yes | Yes | Yes |
| State FE | Yes | Yes | Yes | Yes |
| Year FE | Yes | Yes | Yes | Yes |
| Cluster by Incorporated State | Yes | Yes | Yes | Yes |
Table 7 Panel C: Liquidation value
| (1) | (2) | (3) | (4) | |
|---|---|---|---|---|
| LIQUID | High | Low | High | Low |
| Variable | SOA5 | SOA5 | SOA10 | SOA10 |
| CS | 0.016 (1.25) | 0.030** (2.05) | 0.011 (0.74) | 0.030** (2.06) |
| Controls | Yes | Yes | Yes | Yes |
| Observations | 19,148 | 18,347 | 16,615 | 15,831 |
| Adjusted R-squared | 0.334 | 0.310 | 0.466 | 0.406 |
| Firm FE | Yes | Yes | Yes | Yes |
| State FE | Yes | Yes | Yes | Yes |
| Year FE | Yes | Yes | Yes | Yes |
| Cluster by Incorporated State | Yes | Yes | Yes | Yes |
In Panels A, B and C, we divide the sample into two subsamples (i.e., low and high) based on firm characteristics that reflect the relative salience of stakeholder interests (i.e., CONSUMER, LABOR, and LIQUID), and estimate equation (2) for each subsample. T-statistics are provided in parentheses. ***, **, * indicates significance at the 1%, 5% and 10% levels, respectively. See Appendix A for variable definitions.
Next, we examine whether the effect of stakeholder constituency statutes on dividend smoothing varies by labor intensity. Following Gao et al. (2021), we define labor intensity as the number of employees scaled by sales revenue, reflecting how deeply a firm’s operations depend on its workforce. When stakeholder constituency statutes are adopted, managers gain formal discretion to consider employee interests (Garman and Kubick, 2024). In labor-intensive firms, this shift in legal framework enables managers to reallocate free cash flow to benefit employees, such as training, retention programs, or enhanced workplace conditions, rather than constraining it through smoothed dividends. Accordingly, we predict that firms with high labor intensity are more likely to benefit from the governance shift enabled by stakeholder constituency statutes.
To test this prediction, we estimate our baseline regression model separately for firms with high and low labor intensity. Panel B reports the regression results. In columns (1) and (3), we find that the coefficient on CS is significantly positive in the high-labor-intensity subsample. In contrast, the coefficient on CS is statistically insignificant in the low-labor-intensity subsample. These results suggest that the reduction in dividend smoothing behavior is primarily driven by firms where employees play a more central operational role.
Lastly, we explore whether the effect of stakeholder constituency statutes on dividend smoothing varies with firms’ liquidation value, a proxy for the relative bargaining power of creditors. Acharya et al. (2007) argue that when a firm has a low liquidation value, equity holders possess stronger bargaining leverage relative to creditors, as they can credibly threaten to leave creditors with limited recovery in the event of default. In such environments, stakeholders, particularly debtholders, face weaker protection, and shareholder dominance tends to be more pronounced in the absence of formal safeguards.
Following Berger et al. (1996), we compute liquidation value as the estimated recoverable value of firm assets and classify firms as having low or high liquidation value based on the sample median.13 We then estimate our baseline regression separately for these two subsamples. Panel C presents the corresponding results. In columns (2) and (4), we observe a statistically significant positive association between CS and the speed of adjustment in the low-liquidation-value group. By contrast, in the high-liquidation-value group, the coefficients on CS are small and statistically insignificant. These results suggest that stakeholder constituency statutes have a stronger impact in settings where stakeholders are initially in a weaker position to influence managerial behavior.
Overall, the results reported in Table 7 indicate that the effect of stakeholder constituency statutes on dividend smoothing is more pronounced in settings where stakeholder concerns are more salient and where the potential conflict between shareholders and non-shareholder stakeholders is stronger.14
4.5.2 Agency costs and dividend smoothing
To complement the cross-sectional analysis based on stakeholder salience, we also examine whether the effect of stakeholder constituency statutes varies with firms’ agency costs. We predict that when managers have greater access to discretionary internal funds, the scope for opportunistic behavior is larger, and decisions regarding payout smoothing are more sensitive to governance constraints. Accordingly, if stakeholder constituency statutes function as a governance mechanism by limiting managers’ opportunistic behavior, their impact should be more pronounced among firms with higher agency costs.
We capture agency costs using two standard proxies that reflect the extent of internal resources available to managers: cash holdings (CASH) and free cash flow (FCF), measured following Javakhadze et al. (2014). CASH is defined as cash and short-term investments scaled by total assets, and FCF is computed as operating cash flow minus cash dividends, scaled by total assets. Based on the median values of these two proxies, we classify firms into high- and low-agency-cost groups and re-estimate our baseline model (i.e., equation (2)) for each subsample.
Table 8 reports the results. In Panel A, the CS coefficient is positive and statistically significant only for high-cash firms when using both SOA5 and SOA10, whereas the estimate for low-cash firms are smaller and statistically insignificant. A similar pattern emerges with the free-cash-flow subsample in Panel B. CS is significant in the high-FCF group across both smoothing measures, but insignificant in the low-FCF group. These results suggest that the reduction in dividend smoothing following the constituency statute adoption is more pronounced among firms with higher agency costs.
Table 8 Cross-sectional analysis: Agency costs — Panel A: Cash holdings
| (1) | (2) | (3) | (4) | |
|---|---|---|---|---|
| CASH | High | Low | High | Low |
| Variable | SOA5 | SOA5 | SOA10 | SOA10 |
| CS | 0.043*** (3.67) | 0.018 (1.63) | 0.034** (2.68) | 0.019 (1.34) |
| Controls | Yes | Yes | Yes | Yes |
| Observations | 19,434 | 18,728 | 16,828 | 16,136 |
| Adjusted R-squared | 0.315 | 0.319 | 0.430 | 0.421 |
| Firm FE | Yes | Yes | Yes | Yes |
| State FE | Yes | Yes | Yes | Yes |
| Year FE | Yes | Yes | Yes | Yes |
| Cluster by Incorporated State | Yes | Yes | Yes | Yes |
Table 8 Panel B: Free cash flow
| (1) | (2) | (3) | (4) | |
|---|---|---|---|---|
| FCF | High | Low | High | Low |
| Variable | SOA5 | SOA5 | SOA10 | SOA10 |
| CS | 0.022** (2.02) | 0.018 (1.29) | 0.022* (1.85) | 0.013 (1.08) |
| Controls | Yes | Yes | Yes | Yes |
| Observations | 18,545 | 18,524 | 16,044 | 16,026 |
| Adjusted R-squared | 0.304 | 0.312 | 0.414 | 0.431 |
| Firm FE | Yes | Yes | Yes | Yes |
| State FE | Yes | Yes | Yes | Yes |
| Year FE | Yes | Yes | Yes | Yes |
| Cluster by Incorporated State | Yes | Yes | Yes | Yes |
In Panels A and B, we divide the sample into high- and low-agency-cost subsamples based on each agency-cost proxy (CASH or FCF), using the sample median as the cutoff, and estimate equation (2) separately for each subsample. T-statistics are provided in parentheses. ***, **, * indicates significance at the 1%, 5% and 10% levels, respectively. See Appendix A for variable definitions.
Taken together, the evidence from Tables 7 and 8 indicates that stakeholder constituency statutes reduce dividend smoothing most strongly when stakeholder interests are more salient and when managerial discretion is greater. These results suggest that the influence of the stakeholder constituency statutes is affected by the prominence of stakeholder claims and the extent of internal resources available to managers, consistent with an agency-based interpretation of firms’ payout decisions.
4.6 Dividend smoothing and firm value
Beyond the agency-based role of dividend smoothing, recent studies have renewed interest in its valuation consequences. A premise in this literature is that managers may smooth dividends to signal commitment to maintaining high future payouts, anticipating that investors value stable and predictable dividend streams (De Angelo and De Angelo, 2007). If smoothed dividends serve as a credible signal, investors may reward such firms with higher valuations. Empirical evidence provides mixed conclusions. For example, Larkin et al. (2017) find no significant association between smoothing and firm value using U.S. data. More recently, Brockman et al. (2022) examine this relation in an international setting and document a positive association between dividend smoothing and firm value, consistent with a signaling interpretation in which smoother payouts convey favorable information about future dividends. This line of research relates more broadly to the extensive dividend-level literature showing that stock prices react positively to dividend change announcements (Aharony and Swary, 1980; Amihud and Li, 2006).
Given prior evidence that dividend smoothing may influence firm valuation, it is natural to ask whether the reduction in dividend smoothing induced by stakeholder constituency statutes affects firm value. To examine this possibility, we estimate the following regression based on Brockman et al. (2022) separately for firms incorporated in states that adopted stakeholder constituency statutes and for those in non-adopting states:
where MV is the market value of equity, and DIV is dividends scaled by total assets. The key variable of interest is the interaction term SOA × DIV, which captures whether the valuation effect of dividend changes depends on the extent of smoothing. SOA is measured using the SOA5 and SOA10 estimates from our main analysis. We include several controls (Controls), and detailed descriptions are provided in Appendix A. The coefficient on DIV represents the capitalized effect of a dollar of dividends when smoothing is minimal, while the interaction term tests whether dividend smoothing strengthens or weakens investors’ valuation of dividend changes.
Table 9 presents the results. We find that the interaction terms are statistically insignificant for both smoothing measures in both subsamples. This indicates that dividend smoothing does not directly affect firm value, and that this result holds regardless of whether firms are incorporated in states that adopted stakeholder constituency statutes. This finding is consistent with Larkin et al. (2017), who use U.S. data as in our study and show that smoother dividend paths, while sometimes preferred by investors, do not necessarily lead to higher valuation15.
Table 9 Dividend smoothing and firm value
| (1) | (2) | (3) | (4) | |
|---|---|---|---|---|
| CS States | Non-CS States | CS States | Non-CS States | |
| Variable | MV | MV | MV | MV |
| DIV | 9.815*** (7.79) | 6.900*** (20.21) | 9.842*** (11.47) | 8.326*** (21.19) |
| SOA5×DIV | 0.537 (0.40) | -0.450 (-0.91) | ||
| SOA10×DIV | 2.274 (1.09) | -0.207 (-0.29) | ||
| EARN | 5.209*** (18.88) | 5.293*** (74.17) | 5.158*** (18.05) | 5.080*** (53.90) |
| ΔEARN | -0.647*** (-4.53) | -0.810*** (-17.20) | -0.634*** (-4.79) | -0.737*** (-13.62) |
| LEAD_EARN | 2.360*** (16.82) | 2.461*** (60.37) | 2.271*** (17.73) | 2.422*** (50.23) |
| ΔA | 0.180*** (3.09) | 0.114*** (4.33) | 0.151** (2.64) | 0.079*** (4.08) |
| LEAD_A | 0.337*** (7.50) | 0.249*** (10.56) | 0.312*** (7.54) | 0.207*** (10.72) |
| CAPX | 2.359*** (4.70) | 1.748*** (6.88) | 2.630*** (5.24) | 1.525*** (8.04) |
| ΔCAPX | -0.452** (-2.20) | -0.403*** (-4.45) | -0.581*** (-3.30) | -0.273*** (-4.01) |
| LEAD_ΔCAPX | 1.402*** (6.21) | 0.969*** (5.37) | 1.573*** (7.01) | 0.873*** (5.68) |
| INT | -12.778*** (-11.08) | -10.297*** (-15.37) | -12.228*** (-8.61) | -9.332*** (-14.75) |
| ΔINT | -0.772 (-1.02) | 0.749** (2.45) | -0.526 (-0.67) | 0.487 (1.53) |
| LEAD_ΔINT | -9.611*** (-8.96) | -6.300*** (-20.72) | -8.644*** (-6.97) | -6.040*** (-17.97) |
| ΔDIV | 0.570 (0.30) | 1.278** (2.54) | 0.157 (0.11) | 2.084*** (3.10) |
| LEAD_ΔDIV | 4.672*** (4.73) | 4.813*** (8.91) | 5.223*** (3.53) | 6.624*** (9.60) |
| LEAD_MV | -0.241*** (-12.92) | -0.260*** (-20.91) | -0.235*** (-13.44) | -0.249*** (-18.47) |
| SOA5 | 0.068* (2.00) | 0.065*** (4.15) | ||
| SOA5×ΔDIV | 0.529 (0.23) | 0.970 (1.39) | ||
| SOA5×LEAD_ΔDIV | 2.680** (2.05) | 2.642*** (4.82) | ||
| SOA10 | 0.128** (2.67) | 0.132*** (7.68) | ||
| SOA10×ΔDIV | 1.380 (0.44) | -0.489 (-0.43) | ||
| SOA10×LEAD_ΔDIV | 3.675 (0.95) | 0.178 (0.20) | ||
| Observations | 9,837 | 24,919 | 8,773 | 20,861 |
| Adjusted R-squared | 0.793 | 0.775 | 0.797 | 0.782 |
| Firm FE | Yes | Yes | Yes | Yes |
| State FE | Yes | Yes | Yes | Yes |
| Year FE | Yes | Yes | Yes | Yes |
| Cluster by Incorporated State | Yes | Yes | Yes | Yes |
This table reports the results from regressions examining the association between dividend smoothing and firm value. The dependent variable is the market value of equity (MV). The key variables are the interaction terms between dividends (DIV) and the speed of adjustment measures (SOA5 and SOA10). Columns (1) and (3) use firms incorporated in states that adopted stakeholder constituency statutes, and columns (2) and (4) use firms in non-adopting states. T-statistics are reported in parentheses. ***, **, * indicate significance at the 1%, 5%, and 10% levels, respectively. See Appendix A for variable definitions.
V. Conclusion
This study examines the impact of stakeholder constituency statutes on corporate dividend smoothing behavior. While dividend smoothing has traditionally served as a tool to mitigate agency problems by limiting managerial discretion over free cash flow, the emergence of stakeholder-oriented frameworks prompts a reevaluation of its necessity when managers are legally empowered to consider broader stakeholder interests beyond shareholders.
Using the staggered implementation of stakeholder constituency statutes across U.S. states between 1984 and 2007, we employ a difference-in-differences approach to identify the causal effect of stakeholder orientation on dividend smoothing. Our results show that firms governed by stakeholder constituency statutes engage in significantly less dividend smoothing, reflected in higher speed of adjustment coefficients. This pattern is particularly pronounced in firms where stakeholder interests are more salient—namely, those operating in consumer-facing sectors, with higher labor intensity, or with lower liquidation values. These findings suggest that by broadening directors’ accountability beyond shareholders, stakeholder statutes heighten managerial sensitivity to non-shareholder groups. As a result, the reliance on dividend smoothing as a mechanism to reassure shareholders diminishes in environments where stakeholder concerns carry greater weight.
Overall, this study adds to the literature by linking formal legal shifts in fiduciary responsibility with changes in corporate financial policy. The results highlight how stakeholder-oriented statutes can influence managerial behavior, not only by shaping governance norms but also by altering traditional mechanisms used to manage investor expectations. These findings offer new insights into how institutional environments affect corporate payout decisions and how legal recognition of stakeholder interests can reshape managerial incentives. Although our analysis is grounded in the U.S. adoption of stakeholder constituency statutes, and thus generalization to other institutional settings should be made cautiously, the underlying mechanisms we identify remain conceptually relevant for jurisdictions considering whether to strengthen stakeholder orientation or introduce related governance reforms.
Appendix A
Variable definitions
| Variable | Definition |
|---|---|
| DPS | Dividends per share, calculated as dividends divided by common shares for observations from Compustat. |
| EPS | Earnings per share, calculated as earning per share excluding extraordinary items for observations from Compustat. |
| PAYOUT_RATIO | Payout ratio, calculated as dividends divided by income before extraordinary items. |
| TPR | Target payout ratio, defined as the median of the firm’s historical payout ratios over a trailing 5-year or 10-year window ending in year t, requiring at least three or seven valid observations and a minimum of one positive dividend payout for each calculation period. We define the payout ratio as the proportion of dividends to income before extraordinary items. |
| SOA5 (SOA10) | Speed of adjustment, measured as the estimated slope coefficient ($\beta$) from the following regression: $\Delta DPS = \alpha + \beta dev_{it} + \varepsilon_{it}$, where $dev_{it} = TPR_i + EPS_{it} + DPS_{it-1}$ for the 5-year (10-year) rolling window. We trim the top and bottom 2.5% of the resulting distribution of SOA5 (SOA10). |
| CS | An indicator variable equal to one if a firm’s state of incorporation has adopted stakeholder constituency statutes in a given year, and zero otherwise. |
| SIZE | The natural logarithm of total assets. |
| GROWTH | The percentage change in sales. |
| ROA | Income before extraordinary items divided by lagged total assets. |
| AGE | The number of years since the firm was first covered by Compustat. |
| PER_LOSS | The percentage of years reporting losses in income before extraordinary items, over a rolling 5-year window. |
| BM | The ratio of book value of equity to market value of equity. |
| LEV | The ratio of long-term debts to the sum of long-term debts and book value of equity. |
| EARN_VOL | The standard deviation of income before extraordinary items divided by lagged total assets, over a rolling 5-year window. |
| CASH | Cash holding, defined as cash and marketable securities divided by assets. |
| RD | Research and development expenses, scaled by total assets. Values of zero are assigned to missing observations. |
| DCPX | Capital expenditures scaled by total assets. |
| DVY | Common dividends scaled by the contemporaneous fiscal year-end market capitalization. |
| TURNOVER | The annual average ratio of monthly traded volume of shares to total shares. |
| AF | The number of analysts following for a given year. |
| NINTH | An indicator variable equal to one if a firm’s state of headquarter belongs to the Ninth Circuit in a given year, and zero otherwise. |
| IDD | An indicator variable equal to one if a firm’s state of headquarter has adopted the Inevitable Disclosure Doctrine in a given year, and zero otherwise. |
| CONSUMER | An indicator variable equal to one if the firm is in “consumer goods” industry sectors, and zero otherwise. Following Lev et al. (2010), we define consumer goods industries based on the following four-digit SIC codes: 0000-0999, 2000-2399, 2500-2599, 2700-2799, 2830-2869, 3000-3219, 3420-3429, 3523, 3600-3669, 3700-3719, 3751, 3850-3879, 3880-3999, 4813, 4830-4899, 5000-5079, 5090-5099, 5130-5159, 5220-5999, 7000-7299, and 7400-9999. |
| LABOR | Labor intensity, measured as the number of employees divided by sales. |
| LIQUID | A firm’s liquidation value. Following Berger et al. (1996), we measure this variable as $0.715 \times Receivables + 0.547 \times Inventory + 0.535 \times Capital$, where Receivables is total receivables scaled by total assets, Inventory is total inventories scaled by total assets, and Capital is net property, plant and equipment scaled by total assets. |
| FCF | Free cash flow, defined as operating cash flow minus cash dividends, scaled by total assets. |
| MV | Market value of equity, scaled by total assets. Market value is calculated by multiplying the number of shares outstanding by either the fiscal year-end closing price, if available, or the fiscal year-end monthly closing price. |
| LEAD_MV | Calculated as $MV_{t+1} - MV_t$. |
| EARN | Income before extraordinary items plus interest, deferred tax credits, and investment tax credits, and scaled by total assets. |
| ΔEARN | Calculated as $EARN_t - EARN_{t-1}$. |
| LEAD_EARN | Calculated as $EARN_{t+1} - EARN_t$. |
| AT | Book value of total assets. |
| ΔAT | Calculated as $AT_t - AT_{t-1}$. |
| LEAD_ΔAT | Calculated as $AT_{t+1} - AT_t$. |
| CAPX | Capital expenditures scaled by total assets. |
| ΔCAPX | Calculated as $CAPX_t - CAPX_{t-1}$. |
| LEAD_ΔCAPX | Calculated as $CAPX_{t+1} - CAPX_t$. |
| INT | The annual interest expense scaled by total assets. |
| ΔINT | Calculated as $INT_t - INT_{t-1}$. |
| LEAD_ΔINT | Calculated as $INT_{t+1} - INT_t$. |
| DIV | Dividends scaled by total assets. |
| ΔDIV | Calculated as $DIV_t - DIV_{t-1}$. |
| LEAD_ΔDIV | Calculated as $DIV_{t+1} - DIV_t$. |
Author Biographies
∙ Hui Dong Kim received his Ph.D. in Business Administration from the College of Business Administration at Seoul National University and is currently a visiting researcher at the Institute of Management Research, Seoul National University. He earned his bachelor’s degree in Finance from Hanyang University and completed both his master’s and doctoral degrees in Accounting at Seoul National University. His research interests include macro accounting, income smoothing, dividend smoothing, corporate disclosure, stock price crash risk, and corporate pension policy.
∙ Yong Gyu Lee is an Associate Professor of Accounting at Seoul National University (SNU). He holds a Ph.D. in Business Administration (with a concentration in Accounting) from Columbia University. Before joining the SNU faculty, he was on the accounting faculty at Baruch College and Sungkyunkwan University. His current research interests include voluntary disclosure, managerial incentives, and ESG issues in accounting.