
.jpeg)
Beyond Shadows and Spotlights: Temporal Classification and the Boundaries of Strategic Inference in Korean Pharmaceutical Markets
1 서울대학교 경영대학 SNU Business School, Seoul National University(knight1102@snu.ac.kr)
DOI: https://doi.org/10.17287/kmr.2026.55.5.2079
Abstract
Later market positions can give earlier administrative records strategic meanings that the records themselves do not support. We ask how classification time changes position-specific listing patterns and which strategic claims remain admissible. Using annual snapshots of Korean pharmaceutical reimbursement records, we compare positions measured when listing changes occurred with positions assigned at the end of observation. A paired comparison separates reclassification from sample selection. Endpoint coding substantially reassigns historical positions and materially shifts one tier-specific listing association, whereas the corresponding change for another tier is small and imprecise. Under contemporaneous classification, one negative association weakens, approaches zero, or reverses across event and support definitions; another remains negative but is accompanied by problematic pre-event diagnostics. Historical reconstruction therefore improves temporal alignment without establishing a causal competitive effect. It also does not validate reimbursement-price rank as competitive proximity or listing counts as strategic responses. The paper contributes a temporal-classification diagnostic, a rule for separating administrative associations from strategic-mechanism claims, and a competitive-proximity threshold benchmark. The evidence supports conclusions about time-indexed reimbursement-list positions, while stronger shadow–spotlight interpretations require independent measures of focal-actor identity, competitive proximity, strategic response, and a credible counterfactual.
I. Introduction
A focal market action need not affect every competitor in the same direction. Competitive-dynamics research treats actions and responses as relational rather than uniform across rivals (Chen and Miller, 2012). Localized-competition logic suggests that organizations with similar positions and resource requirements face stronger competitive interaction (Baum and Mezias, 1992; Chen, 1996), and perceived competitive tension can vary across focal-rival dyads (Chen et al., 2007). Category-expanding activity can nevertheless benefit other products by increasing attention to the broader market (Shapiro, 2018). A single action may therefore impose a shadow on relationally proximate competitors while placing more distant competitors in a spotlight. Treating all non-focal firms as a homogeneous residual can conceal this distance-dependent pattern.
Regulated pharmaceutical markets make heterogeneous competitive spillovers attractive to study but difficult to evaluate. Reimbursement records identify listed products and maximum reimbursable amounts, allowing products to be ordered within a therapeutic arena. They do not directly reveal demand substitution, resource similarity, marketing effort, formulary access, brand reputation, or legal originator status. A product at an arena’s highest observed reimbursement amount occupies the administrative TOP position; that position alone does not establish that the product is an originator, dominant firm, or strategically salient actor. Likewise, a within-arena reimbursement-price percentile can be calculated exactly without independently measuring the relational proximity $P_{im}$ in the theory.
We ask: When past market responses are classified by a time-varying administrative position, how does using a later endpoint rather than the contemporaneous snapshot alter the recovered position-specific pattern, and which shadow–spotlight claims remain admissible? Shadow and spotlight supply the motivating strategic benchmark, while the analysis separates competitive proximity from its administrative marker. This separation is important because a current price rank applied to a past listing can incorporate subsequent price changes, selective persistence, and later arena membership.
We formalize this tension in a threshold account. Let $a$ denote attributes of the focal action, and let $P_{im}$ denote competitor $i$’s relational proximity to the focal actor in market $m$, with larger values indicating greater expected demand-side and strategic overlap.
The net response is
where $E_{m}(a)$ captures the arena-wide expansion opportunity associated with focal activity and $C_{m}(P_{im}, a)$ captures localized competitive pressure. If $C_{p} > 0$, the response becomes less favorable as competitive proximity increases. An interior threshold $P_{m}^{*}$ satisfies $C_{m}(P_{m}^{*}, a) = E_{m}(a)$: a shadow occurs above this proximity threshold and a spotlight below it. Attributes that strengthen expansion more than localized pressure move the threshold toward more proximate competitors; attributes that strengthen localized pressure more strongly move it toward more distant competitors. Shadow and spotlight are therefore conditional regions of the same function rather than independent mechanisms that must receive equal empirical support.
A five-link claim-admissibility rule connects this theoretical benchmark to the evidence. A strategy claim based on administrative records must identify the focal actor, represent the latent relation, align the marker and risk set in time, record the intended response, and support the intended comparison. These requirements define actor, marker, temporal, outcome, and identification validity. Together they set the distance an empirical conclusion may travel when one or more links remain unverified; they do not replace the shadow–spotlight theory.
Unobservable constructs are central to strategy theory (Godfrey and Hill, 1995), construct–measure scholarship requires explicit correspondence between concepts and observations (Adcock and Collier, 2001; Edwards and Bagozzi, 2000), and archival-proxy research documents the danger of assigning one field to several constructs (Boyd et al., 2005). Event-study estimators then discipline the comparison conditional on the coded event, outcome, and risk set (Callaway and Sant’Anna, 2021; Sun and Abraham, 2021).
We apply the rule in a worked measurement audit of the first observed TOP-position arrival in an established Korean pharmaceutical arena. A TOP-position arrival occurs when a product appears, relative to the immediately preceding annual Health Insurance Review and Assessment Service (HIRA) snapshot, at the arena-year maximum listed reimbursement amount. Subsequent outcomes count products newly appearing relative to the preceding snapshot and classify them by their arrival-snapshot reimbursement positions. This administrative label is deliberately narrow: the linked HIRA and Ministry of Food and Drug Safety (MFDS) fields do not verify originator status, patent lineage, market dominance, or market attention.
Using 2012–2025 HIRA snapshots, we reconstruct historical arena membership, product risk sets, and price positions without substituting a current price schedule or current MFDS arena for dated HIRA fields. Item identity is established through a high-coverage unique MFDS linkage, so the analysis pertains to historically observed, uniquely linked records. The primary event-study panel contains 43,798 arena-year rows, 367 arenas with a first observed TOP-position arrival, and 6,604 comparison arenas. We evaluate temporal classification by comparing historical and 2025 endpoint tiers on the same 1,446 endpoint-matchable listing-appearance transitions. Only 53.80% retain the same category. Endpoint coding materially changes the T3 association (+0.2728, SE = 0.0879, p = .0019), whereas the paired T2 change is small and imprecisely estimated (−0.0011, p = .936). The primary listing analyses therefore use arrival-snapshot positions.
The T2 and T3 administrative patterns warrant different conclusions. In the selected evaluable historical risk set, T2 is negative over event times +1 to +3 (−0.0172, p = .0369), but it approaches zero or reverses under alternative focal-event definitions and attenuates under symmetric common support (−0.0076, p = .420). We therefore treat T2 as a limited, definition-contingent marker association. T3 is negative (−0.5340, p = .0236), and its pre-event diagnostics fail; this implementation does not support the originally predicted positive T3 direction.
The paper makes three contributions, ordered by evidentiary strength. First, it identifies classification time as an estimand-defining measurement choice in longitudinal administrative research. Endpoint coding of a historical observation can combine the contemporaneous marker with subsequent reclassification and selective persistence; the paired audit isolates the reclassification component among the same matchable transitions. Second, it develops a non-compensatory claim-ceiling rule that maps actor, relational-marker, temporal, outcome, and identification warrant to the maximum permissible inferential level. Third, it clarifies the substantive benchmark by modelling shadow and spotlight as regions separated by an endogenous competitive-proximity threshold and deriving how action and market attributes shift that boundary. The threshold organizes the claim to be validated; the pharmaceutical application illustrates how historical reconstruction can improve temporal warrant without converting an administrative marker into a direct test of the latent mechanism.
The paper proceeds as follows. Section II develops the competitive-proximity threshold, its comparative statics, the temporal-classification principle, and the claim-ceiling bridge. Section III presents the institutional setting and worked administrative measurement audit. Section IV reports sample support, the paired temporal-classification result, position-resolved marker patterns, sensitivity analyses, and administrative departure outcomes. Section V discusses the temporal-classification finding, the claim-ceiling rule, and the threshold benchmark, followed by mechanism boundaries, practical use, and data required for a direct test. Section VI concludes.
Ⅱ. From Shadow–Spotlight Claims to Time-Indexed Administrative Measurement
2.1 Expansion and localized competitive pressure
Competitive proximity increases with expected demand-side and strategic overlap between actors in the same market; competitive distance decreases as that overlap rises. Chen (1996) links competitor analysis to market commonality and resource similarity, emphasizing that competitive relationships can be pair-specific and asymmetric. Peteraf and Bergen (2003) similarly argue that competitor identification should consider functional similarities in products and resources rather than common market membership alone. Localized-competition research shows that rivalry can be strongest among organizations with comparable positions and resource requirements (Baum and Mezias, 1992). These arguments imply that a focal market action can impose greater competitive pressure on more proximate rivals.
The same focal activity may also expand attention to the broader market. With advertising directly observed, Shapiro (2018) finds positive demand spillovers from prescription-drug advertising to competing products through market expansion. Localized displacement and market expansion need not be competing explanations chosen after observing a coefficient; they may operate simultaneously. Let $a$ denote attributes of the focal action, $P_{im}$ competitor $i$’s relational proximity to the focal actor in market $m$, and $R_{im}(a)$ its response:
Here, $E_{m}(a)$ is an arena-wide expansion component and $C_{m}(P_{im}, a)$ is localized competitive pressure. Expansion can arise when an action increases category attention, legitimacy, information, or access that other actors can share. Localized pressure rises when the focal action appropriates demand or scarce resources from actors with greater substitution, market commonality, or resource overlap. The focal action and market context can therefore affect both components rather than merely adding a common shock to otherwise fixed rivals.
2.2 Distance gradient and endogenous threshold
Assume $C_{p} > 0$, so localized pressure increases with relational proximity. Then the response is strictly decreasing in proximity.
Proposition 1 ― Distance gradient. For a fixed focal action and market, a more competitively proximate actor has a less favorable response: if $P_{jm} > P_{km}$, then $R_{jm}(a) < R_{km}(a)$.
This relative prediction does not require both signs to appear. If expansion is below localized pressure even for the most distant actor, all observed responses occupy the shadow region. If expansion exceeds localized pressure even for the most proximate actor, all occupy the spotlight region. Mixed signs require an interior crossing.
Proposition 2 ― Shadow–spotlight threshold and boundary shift.
If $C_{m}(P_{\min}, a) < E_{m}(a) < C_{m}(P_{\max}, a)$ and $C_{m}$ is continuous and strictly increasing in $P$, a unique threshold $P_{m}^{*}$ satisfies $C_{m}(P_{m}^{*}, a) = E_{m}(a)$. Actors with $P < P_{m}^{*}$ occupy the spotlight region, and actors with $P > P_{m}^{*}$ occupy the shadow region.
To examine a market or action attribute $z$, write the components as $E_{m}(a, z)$ and $C_{m}(P, a, z)$. If both are continuously differentiable near the threshold and $C_{p}(P_{m}^{*}, a, z) > 0$, the implicit-function theorem gives
All derivatives are evaluated at $(P_{m}^{*}, a, z)$. Attributes that strengthen category expansion more than localized pressure enlarge the spotlight region; attributes that strengthen localized pressure more strongly enlarge the shadow region. The proposition therefore identifies all-shadow, all-spotlight, and mixed regimes and specifies how focal-action and market conditions move their boundary.
2.3 Competitive proximity, temporal classification, and the administrative marker
The theoretical $P_{im}$ is not a numerical difference or percentile in reimbursement price. It describes a relation between actors; within-arena reimbursement rank is a separately observed administrative position score. It may contain useful information because products at different regulated price positions can face different institutional and commercial conditions, but its correspondence with relational proximity must be established rather than assumed.
Maximum reimbursable amounts are not transaction prices, equal amounts create ties, changes in arena membership alter percentiles mechanically, and clinical substitution may depend on prescribing routines, formulation, reputation, or distribution arrangements that are not observed. Marker validity therefore requires evidence beyond computational precision. Cutoff stability can diagnose dependence on a partition, but it cannot establish convergence with demand overlap or resource similarity.
The 10/30/70 partition is a descriptive score rather than a theoretical law. Among non-TOP products, it assigns T1 through the 10th percentile, T2 above the 10th through the 30th percentile, T3 above the 30th through the 70th percentile, and T4 above the 70th percentile. Alternative 5/25/65 and 15/35/75 partitions and the rank/N formula are marker-coding sensitivities; ties and focal-event definitions are event sensitivities. Decile and continuous-percentile summaries are raw distribution checks rather than model-based robustness estimates.
Temporal classification is part of marker construction whenever position is path-dependent. An estimand is the target quantity that connects statistical evidence to theory (Lundberg et al., 2021); changing when a marker is assigned can therefore change what the analysis describes. Let $M_{it}$ denote the administrative position of item i when it appears in year t, and let $M_{iT}$ denote its position at the endpoint T. If later price changes, survival, or arena membership affect $M_{iT}$, classifying an earlier appearance by $M_{iT}$ combines the contemporaneous event with subsequent history. Endpoint- and arrival-coded estimates are comparable as historical position estimates only if classification is invariant or later reclassification and matchability are ignorable for the intended contrast.
Temporal-classification corollary. When $M_{iT}$ incorporates post-appearance changes or selective persistence, an endpoint-coded historical position association generally combines the contemporaneous marker with later selection and reclassification. A difference between endpoint- and arrival-coded estimates diagnoses measurement dependence; it does not by itself identify the cause of the change or validate either marker as competitive proximity.
2.4 From latent theory to admissible claims
The threshold account can be evaluated only when empirical variables correspond to its focal actor, relational proximity, timing, response, and comparison. The five-link chain specifies the evidence needed to connect the theory to the administrative application. Following the principle that validity depends on correspondence between a systematized concept and its observations (Adcock and Collier, 2001), each link can have absent, partial, or sufficient warrant for the stated claim. Partial warrant may support a contracted claim; absent warrant removes claims that require that premise.
Actor validity concerns the correspondence between the observed focal listing and the theoretically relevant actor. A top-price product may be a reference product, generic, relisted product, or another product type. Without an independently verified actor field, the event cannot be labeled an originator or dominant-firm event.
Marker validity concerns the correspondence between reimbursement-price position and relational proximity. Edwards and Bagozzi (2000) emphasize that construct–measure relations require explicit conceptual specification. Price rank has face relevance as an administrative ordering but lacks independent validation against substitution, market commonality, resource similarity, prescribing, or channel overlap.
Temporal validity concerns when the marker and risk set are measured. A current price schedule applied to earlier years can incorporate later price changes, later listings, and selective persistence. Historical snapshots are therefore required to compute arena membership and rank at each observed time.
Outcome validity concerns what an appearance or disappearance means. A product newly appearing relative to a preceding HIRA snapshot is an administrative reimbursement-list appearance; it is not necessarily a first-ever approval, commercial launch, or voluntary strategic decision. HIRA disappearance and MFDS cancellation are distinct endpoints, neither of which directly measures sales exit.
Identification validity concerns the event-time comparison. The first observed TOP-position arrival is selected by an evolving administrative market, and event timing is not shown to be exogenous. Credible interpretation therefore requires transparent comparison support, physically absent simultaneous event observations, pre-event diagnostics, and claims no stronger than the observed design.
The links are noncompensatory across logically distinct premises. Better temporal alignment cannot establish actor identity; a more credible counterfactual cannot validate the relational marker; and marker stability cannot transform an administrative listing into strategic behavior. For a target claim $K$, let $J(K)$ contain the five universal translations and any additional premise logically required by the specific mechanism invoked. The claim is admissible only if every required premise has the warrant demanded by its exact actor label, relational meaning, behavioral verb, population, timing, and causal force.
When a premise is absent or only partial, the claim contracts to the observed administrative referent or a qualified association; strength on another dimension cannot compensate.
Validation subsamples, independent indicators, or explicitly modelled uncertainty can strengthen warrant within a link. The rule requires correspondence, not error-free data.
Proposition 3 ― Claim ceiling. A construct-, mechanism-, or causal-level spillover claim cannot exceed its weakest essential universal link or claim-specific premise. Temporal alignment can upgrade an endpoint-coded marker to a contemporaneous administrative association, but it cannot establish competitive distance, strategic response, causality, or a named mechanism when the corresponding warrant remains absent.
The result is level-asymmetric inference. Administrative records can support analyses of their own coding stability and associations. They support construct- or theory-level conclusions only when the required bridges are warranted. Until then, neither a favorable nor an adverse marker association determines the theory.
2.5 Mapping the pharmaceutical application
The original marker coding, developed before the present reconstruction, assigned a negative direction to T2 as its shadow-coded marker and a positive direction to T3 as its spotlight-coded marker. The present audit retains these directions only as retrospective administrative benchmarks. They are not formal tests of Propositions 1–2 because the data do not establish that T2 and T3 are ordered values of relational proximity $P_{im}$ or that the relevant category-expanding action is present.
The application evaluates which claims this administrative implementation can support. It strengthens temporal alignment but lacks sufficient actor, relational-marker, strategic-outcome, and causal-identification warrant. T2 and T3 are evaluated as neutral administrative position categories; “shadow” and “spotlight” are reserved for the latent regions defined by $P_{m}^{*}$.
No identity or mediation hypothesis is formulated: the data contain no direct identity, marketing, reputation, formulary, or category-expansion measure, and a post-event T3 stock cannot identify a sequential mechanism.
Ⅲ. A Worked Administrative Measurement Audit
The application audits marker construction and the resulting claim ceiling. It does not estimate the latent expansion component, localized competitive pressure, or competitive-proximity threshold in Propositions 1–2.
3.1 Korean reimbursement setting
South Korea introduced the positive-list reimbursement system in December 2006, and HIRA convened its first Drug Reimbursement Evaluation Committee meeting in 2007 (Health Insurance Review and Assessment Service [HIRA], 2007; Park et al., 2012). HIRA price lists record reimbursement status and each product’s maximum reimbursable amount. These fields provide detailed administrative histories, but they are not product-level sales, prescriptions, transaction prices, or market shares.
The 2012 drug-pricing reform abolished parts of the earlier stepwise pricing structure and generally moved products more than one year after listing toward a 53.55% rule, while retaining separate first-year calculations and exceptions (Cho et al., 2015; Ministry of Health and Welfare [MOHW], 2011). The reform provides institutional context for the administrative price environment. It did not make all products identical, eliminate all price differences, or supply evidence of an identity mechanism; it is not a mechanism test.
Three administrative endpoints must remain distinct. Appearance between adjacent annual HIRA snapshots is a reimbursement-list appearance. Disappearance is HIRA reimbursement delisting. An MFDS cancellation date records regulatory cancellation. None is automatically interpreted as commercial launch or sales exit.
3.2 Data sources and historical reconstruction
The source archive contains 16 HIRA snapshots covering 2009, 2010, and 2012–2025. The parser scanned 441,335 rows and retained 317,119 positive-price rows; product-code, ingredient, and dosage-form fields were complete in those records. Because 2011 is unavailable and the analysis requires adjacent annual snapshots and lagged arena membership, the analytic position panel covers 2012–2025.
Restricting the 317,119 positive-price rows to 2012–2025 leaves 287,914 rows. Removing 43 invalid historical-arena rows and 321 rows attached to ambiguous or unmatched HIRA codes leaves 287,550; collapsing multiple codes that identify the same item-by-arena-by-snapshot record produces a net reduction of 1,758 rows, and excluding 295 within-key price-conflict rows yields the 285,497-record canonical panel. These steps close the row-count reconciliation; they do not constitute an additional sample-selection model.
HIRA product codes are linked to the MFDS standard-code master through cleaned product-code and standard-barcode mappings. Among 44,345 distinct valid HIRA codes in the primary window, 44,253 link uniquely, yielding 99.79% code coverage and 99.89% row-weighted coverage. Two ambiguous codes account for 17 rows, and 90 unmatched codes account for 304 rows. The bridge stabilizes item identity and attaches regulatory dates; it does not replace the arena recorded in a historical HIRA snapshot.
The primary unit is an MFDS item observed in a contemporaneous HIRA ingredient–form arena and snapshot. The canonical item-snapshot panel contains 285,497 observations, 32,909 items, 40,957 item-by-arena units, and 8,202 arenas. A product-code-by-arena panel provides a unit sensitivity. Items observed in more than one arena remain in the canonical panel. At a transition boundary, an item appearing in a new arena while present elsewhere in the preceding snapshot is censored from the appearance count; an item disappearing from one arena while remaining elsewhere is censored from the delisting count.
3.3 Arena, TOP position, and tier outcomes
An arena is the ingredient-and-dosage-form code recorded in each historical HIRA snapshot. This is a regulatory grouping, not a direct measure of clinical substitutability. An arena-year’s TOP position is the maximum listed reimbursement amount among products observed in that arena and year. It is an arena-relative maximum, not a single common legal price assigned to the arena.
All products tied at the arena-year maximum are classified as TOP. For arenas with more than one product, price is ranked from high to low, ties receive the average rank, and the main percentile is (midrank − 1)/(N − 1), bounded to the unit interval, where N is the total number of products in the arena-year. Singleton arenas are classified as TOP and do not enter non-top tier cutoffs. For non-top products, T1 through T4 use the descriptive 10/30/70 boundaries stated above.
The observed percentile is kept distinct from $P_{im}$. In Section II, $P_{im}$ represents latent relational proximity; the tier score used here is an administrative classification whose correspondence with $P_{im}$ remains unverified.
A product is newly appearing when its item-by-arena unit is absent in the immediately preceding observed annual snapshot and present in the current snapshot, after identifiable arena migration is censored. This is not necessarily the product’s first appearance over its lifetime: a product returning after an observed absence can be counted again. The outcome is therefore a transition-specific administrative appearance. Its tier is measured in the snapshot in which it appears and is an outcome category rather than a predetermined strategic position.
For HIRA delisting and MFDS cancellation, an incumbent is classified by its tier in the immediately preceding snapshot. This avoids assigning a disappeared item a later price rank. A separate landmark description classifies incumbents by their event-time −1 tier.
3.4 Event, left censoring, transitions, and risk set
An established arena is an arena observed in the immediately preceding annual snapshot with at least one listed product. The event is the first observed transition in the clean analytic window in which a newly appearing product occupies the contemporaneous TOP position of such an arena. Because the window begins in 2012 and 2011 is absent, “first observed” does not establish the arena’s first such event over its full history. The event definition is left-censored and may also include a returning listing after an observed absence.
An arena must be observed at event times −2, −1, +1, and +2 to enter the eligible event registry. Here, “observed” means that the historical snapshot contains at least one eligible positive-price listing in that arena. An absent arena-year is not imputed as zero: it may represent administrative risk-set exit, no eligible reimbursed product, or a break introduced by bridge and eligibility rules. An arena with an observed marker arrival that fails this support rule is excluded, not recoded as a never-event arena. Here, “never-event” denotes an arena with no qualifying marker arrival observed during 2012–2025; it does not imply that no such event occurred before 2012.
Marker-event arenas must remain administratively observable through +2, whereas comparison arenas with no observed marker event receive no hypothetical event-specific ±2 requirement. The primary estimand is therefore conditional on that future-observability contract for event arenas.
Event time 0 is physically absent from every estimation panel. The focal product and other same-snapshot appearances are interval-censored within the same annual transition, so their within-interval order cannot be established.
Because the primary risk set treats future observability asymmetrically, a retrospective common-support diagnostic applies one calendar rule to both groups. It fixes event cohorts at 2020–2022, restricts comparisons to arenas with no marker event observed during 2012–2025, and requires every event and comparison arena to be observed in all calendar years 2017–2025. Eligibility is determined before each event-year row is removed. This yields 235 event arenas, 2,240 never-observed-marker-event comparison arenas, and 22,040 estimation rows. The diagnostic changes both the population and comparison group: it describes a balanced late-cohort administrative risk set and is not a substitute estimate for all observed events.
The common-support restriction is itself selective. Among initially eligible 2020–2022 event arenas, included arenas are larger at event time −1 than excluded arenas (standardized difference = 0.490), and the 2022 cohort is less likely to satisfy the rule in a predetermined-covariate linear-probability diagnostic (−0.281, heteroskedasticity-robust p < .001).
Symmetric observability removes the original group asymmetry, but the complete-window sample is neither representative nor exogenous: among never-event candidates, complete- versus incomplete-window standardized differences are 1.227 for log arena size and 0.727 for size momentum.
The historical bridge identifies a structural transition at the 2015–2016 boundary. The sequential-transition reconstruction contains 2,434 arena transitions, 2,252 of which arrive in 2016. A separate code-linkage audit examines 2,365 arena switches across that boundary and links 2,315 through an unchanged current code or an explicit pre-cleanup code. Calendar year 2016 is therefore absent as a transition endpoint in the primary analysis, and support is rechecked after its removal.
The event registry contains 626 initially eligible event arenas and 6,638 never-observed-marker-event comparison candidates. Fifty-three events occurring in 2016 are removed, and 206 otherwise eligible event arenas lose the required support after calendar year 2016 is removed. Thirty-four comparison candidates have no observation outside 2016 and therefore leave the model panel. The primary event-study panel contains 367 event arenas in five cohorts―70 in 2019, 104 in 2020, 127 in 2021, 45 in 2022, and 21 in 2023―and 6,604 comparison arenas, for 6,971 arenas and 43,798 arena-year observations.
Before estimator balancing, raw eligible-panel support equals 367 event-arena observations at +1 and +2, 344 at +3, 292 at +4, and 168 at +5. The balanced +1 to +3 estimator uses the 2019–2022 cohorts, with 346, 346, and 344 observed event arenas across those three event times; the 2023 cohort is excluded.
The long-window estimators use the 2019 and 2020 cohorts only and have 168 observed event arenas at +5. Raw support at −5 is 95, but the balanced dynamic estimate at −5 uses cohorts 2019, 2020, and 2022 and 79 observed event arenas because the 2021 cell falls in calendar 2016 and the 2023 cohort is excluded. Appendix A3 reports the contributing cohort lists and total observed event-arena counts.
3.5 Outcomes
The primary outcomes are arena-year counts of products newly appearing on the reimbursement list, classified as T2 or T3 by their contemporaneous arrival-snapshot administrative position. They count new listing flows; they do not count incumbent products that merely move between ranks as arena composition changes. Secondary listing outcomes are TOP, T1, T4, total appearance counts, binary indicators, decile counts, and continuous percentile mass. Because tier-specific counts combine the number of new appearances and their assigned positions, they are described as tier-specific listing patterns rather than as shares of a fixed total.
Three administrative departure measures remain separate. One-snapshot HIRA delisting records absence at the next snapshot after identifiable arena migration is censored. Persistent HIRA delisting requires continued absence in the following snapshot when that horizon is observable. MFDS cancellation records an authorization cancellation date between adjacent snapshot dates for an incumbent item. These endpoints do not observe sales discontinuation.
The event-time −1 tier landmark reports post-event status for incumbents present at that reference time. It has no valid lead structure and is descriptive. It is not treated as a survival model or a mechanism test.
3.6 Estimation, temporal-classification design, and diagnostic hierarchy
The primary estimator follows the group-time difference-in-differences framework of Callaway and Sant’Anna (2021), implemented through outcome regression with not-yet-event comparisons; arenas with no marker event observed during 2012–2025 remain eligible comparisons throughout. The model uses an unbalanced panel, event time −1 as the universal base period, arena as the panel and clustering unit, 999 multiplier-bootstrap repetitions, and 95% simultaneous bands for the displayed dynamic path.
For each cohort and event time, the estimator first calculates a contrast relative to that cohort’s event-time −1 observation. At each supported event time, the aggregation procedure averages the estimable cohort-specific contrasts using cohort shares renormalized over the cohorts available at that event time. The reported +1 to +3 association is the simple average of those three event-time aggregates. Its standard error is calculated from the corresponding influence functions and therefore retains their covariance rather than treating the three estimates as independent.
The +1 to +3 aggregate and displayed dynamics require support through event time +3 and therefore use the 2019–2022 cohorts. The 2023 cohort contributes to the eligible panel and raw support at +1 and +2 but is excluded from this aggregate because +3 is not observed. Cohort shares use the registered cohort sizes 70, 104, 127, and 45; within those cohorts, observed event-arena counts are 346 at +1, 346 at +2, and 344 at +3. Available event-time −1 and post-event observations enter each group-time contrast without imputing missing arena-years; at +3, 103 of 104 cohort-2020 arenas and 126 of 127 cohort-2021 arenas are observed.
The +1 to +5 and +4 to +5 aggregates use only the 2019 and 2020 cohorts and have 168 observed event arenas at +5. Event timing is endogenous and some pre-event diagnostics reject, so the estimates are described as cohort-weighted event-time associations rather than causal average treatment effects.
The displayed dynamic window is −5 through −2 and +1 through +3; −1 is the reference and 0 is absent. Average post-event associations are calculated for +1 to +3, +1 to +5, and +4 to +5. Local pre-event diagnostics jointly test −3 and −2. Wider diagnostics jointly test −5 through −2.
Because the removed 2016 calendar cell interrupts different cohorts at different leads, the balanced dynamic estimate still changes composition across the lead vector: −5 uses cohorts 2019, 2020, and 2022 (79 observed event arenas); −4 uses 2019, 2021, and 2022 (170); −3 uses 2020, 2021, and 2022 (259); and −2 uses all four 2019–2022 cohorts (346). The joint tests are therefore diagnostics, not proof of parallel trends; p > .05 is not interpreted as equivalence because an insignificant pre-trend test does not establish parallel trends (Roth et al., 2023).
Across 120 outcome-specific group-time cells, 20 have weak or unavailable support. Of 45 raw-support cells, 33 are adequate, nine are unavailable, and three are weak; Appendix A3 reports the contributing cohort lists and total observed event-arena counts.
Horizon and diagnostic roles. The +1 to +3 average is the longest balanced near-term summary supported by the 2019–2022 cohorts after the 2016 transition is removed; it is a support-defined administrative horizon, not a theory-derived mechanism lag. The +1 to +5 and +4 to +5 summaries are secondary descriptions carried only by the 2019 and 2020 cohorts.
The coding audit and its stress grid were assembled retrospectively, so the paper does not designate a confirmatory hypothesis family. Exact p-values and intervals characterize sampling uncertainty but do not determine a theory verdict.
Simultaneous bands summarize uncertainty within each displayed dynamic path; joint lead tests flag design concerns; the ten-row grid compares nonexchangeable definitions qualitatively; and common-support, endpoint-pairing, estimator, and departure analyses are auxiliary diagnostics. The Holm values for the common-support T2/T3 pair are a local two-outcome sensitivity, not familywise confirmation of the larger retrospective analysis. No conclusion is upgraded because a nominal threshold is crossed.
The paired historical-versus-endpoint classification comparison is the primary temporal diagnostic. The paired-classification transition sample links historical listing appearances by the same item identifier and arena to the 2025 snapshot. Model A uses all 2,316 transitions with their arrival-snapshot tiers. Models B and C use the 1,446 transitions that remain in the same arena in 2025: B retains the historical tier, whereas C substitutes the 2025 tier.
A direct arena-year difference outcome, C minus B, isolates the consequence of changing the classification of those common rows from arrival-snapshot to 2025 price tiers.
The B−A point-estimate difference reflects endpoint matchability and persistence selection; no sampling uncertainty for that derived cross-model difference is claimed. Comparing B with C describes endpoint reclassification among matchable listing appearances. The paired difference does not identify why later classifications differ, recover unmatched transitions, or estimate a causal effect of price adjustment.
The following point-estimate accounting identity organizes the two sources of difference:
The first term records the B−A point-estimate change associated with endpoint matchability and persistence selection; it is not itself a directly estimated contrast with a reported standard error. The second term is the directly estimated paired reclassification contrast among the same rows. Neither term is causal without additional assumptions. Separating them prevents reclassification from being mistaken for a stable historical position effect.
The common-support diagnostic uses the same outcome-regression implementation but fixes cohorts at 2020–2022, uses comparison arenas with no marker event observed in 2012–2025, and reports event times −3, −2, +1, +2, and +3. All three cohorts and all 235 event arenas contribute at every displayed event time, so the local joint test no longer changes cohort composition. T2/T3 post-window p-values are also Holm-adjusted as a two-outcome family. These safeguards diagnose composition and risk-set sensitivity; they do not make non-rejection an equivalence test or remove endogenous event timing.
Section III.7 defines the scope of the retrospective ten-specification sensitivity grid, which Table 4 reports in Section IV. Auxiliary diagnostics vary transition exclusions, comparison groups, never-concurrent multi-arena handling, predetermined size and momentum, common support, and endpoint-price classification without entering that grid.
<Table 4> Retrospective Core Definition-Sensitivity Grid, Event Times +1 to +3
| Specification | T2 estimate [95% CI] | T3 estimate [95% CI] | Rows / arenas |
|---|---|---|---|
| Primary: 10/30/70, item×arena | −0.017 [−0.033, −0.001] | −0.534 [−0.996, −0.072] | 43,798 / 6,971 |
| Cutoffs 5/25/65 | −0.073 [−0.133, −0.013] | −0.542 [−1.007, −0.077] | 43,798 / 6,971 |
| Cutoffs 15/35/75 | −0.015 [−0.040, 0.010] | −0.551 [−1.005, −0.097] | 43,798 / 6,971 |
| Alternative rank/N percentile | −0.018 [−0.037, 0.002] | −0.542 [−1.026, −0.057] | 43,798 / 6,971 |
| Single TOP-position product at first event | 0.014 [−0.028, 0.056] | 0.086 [−0.062, 0.233] | 41,234 / 6,670 |
| Focal listing meets prior arena maximum | 0.000 [−0.012, 0.012] | 0.011 [−0.026, 0.048] | 43,125 / 6,895 |
| Product-code×arena unit | −0.013 [−0.029, 0.003] | −0.351 [−0.750, 0.048] | 36,450 / 6,137 |
| Single HIRA arena per item | −0.042 [−0.072, −0.013] | −1.052 [−1.951, −0.154] | 25,199 / 3,478 |
| Revised-product-code bridge available in all snapshots | −0.001 [−0.033, 0.031] | −0.241 [−0.596, 0.114] | 25,687 / 3,114 |
| MFDS arena-agreement subset | −0.020 [−0.050, 0.010] | −0.366 [−0.841, 0.109] | 24,283 / 2,978 |
Note. The table and Figure 2 report the same ten retrospective specifications. The rows probe nonexchangeable marker, event, unit, and bridge definitions and do not form a model vote or a confirmatory family. Requiring a single TOP-position product in the full first-event arrival snapshot reverses the primary T2 direction; prior-maximum produces a result descriptively close to zero but is not an equivalence test. The negative T2 association is classified as limited and definition-contingent; the originally predicted positive T3 association is not supported in the present implementation. Neither category is a validated competitive-distance measure or a direct test of Propositions 1–2. Pointwise intervals are unadjusted descriptive diagnostics. Appendix A5–A7 reports the available p-values and summaries of lead diagnostics; Appendix A11 reports predetermined size and momentum; Appendix A12 summarizes the supplementary analyses and their evidentiary roles.
Sun–Abraham cohort-interacted estimates, linear two-way fixed-effects estimates, and binary linear-probability models retain 43,199 observations and 6,372 arenas after within-model exclusions (Sun and Abraham, 2021). Poisson fixed-effects models retain only 363 observations in 44 arenas for T2 and 1,497 observations in 175 arenas for T3 because of extreme separation attrition; they are treated as attrition diagnostics rather than substantive stability evidence.
3.7 Retrospective evaluation of the original marker coding
The original marker coding predates the present reconstruction. We retain its negative T2 and positive T3 directions as retrospective marker-level benchmarks. “Shadow” and “spotlight” are not used as empirical labels for these categories because T2 has not been validated as relational proximity and T3 has not been validated as relational distance.
The evaluation is explicitly retrospective. The original endpoint-coded results were known before the historical reconstruction, five-link framework, ten-row stress grid, and current classifications were integrated.
The rules for the supplementary common-support, stable-cohort, endpoint-pairing, sparsity, and event-semantic diagnostics were documented before those diagnostics were run, and the reporting rule required favorable, null, and adverse results to be retained. This sequence records the limited timing of the supplementary diagnostics; it does not make the application preregistered, ex ante, or independently confirmatory. Appendix A12 summarizes the stages and their evidentiary roles.
Before the historical reconstruction, the original endpoint-price specification had rejected its joint pre-event test (p < .001) and reversed the T2 sign after momentum adjustment (+0.042). Because that specification used the superseded endpoint-price and current-master construction, those findings motivated reconstruction and are not confirmatory evidence. The historical panel reports the corresponding predetermined-covariate diagnostic separately below and in Appendix A11.
The ten-row stress grid covers four distinct implementation uncertainties: marker partition, focal-event semantics, counting unit and arena multiplicity, and bridge or arena concordance. Transition exclusions, comparison-group changes, predetermined covariates, common support, endpoint pairing, and alternative estimators remain separately labelled diagnostics because they change the transition set, target population, or estimator rather than the marker implementation alone. This organization clarifies the role of each diagnostic; it is not claimed to be outcome-independent.
Ⅳ. Results
4.1 Historical reconstruction and sample support
Table 1 reports the historical sample and event support. The item panel contains 18,496 raw newly appearing item-by-arena transitions. Censoring 749 identifiable migration-in transitions leaves 17,747 appearance transitions. Of 19,769 raw disappearances, 6,366 are identifiable migrations to another arena, leaving 13,403 HIRA delisting transitions. At the 2016 endpoint alone, 3,877 of 4,344 raw disappearances are classified as migration.
<Table 1> Historical Sample and Event Support
| Panel A. Historical sample and transition construction | |||
|---|---|---|---|
| Metric | Count | Unit | Notes |
| Eligible snapshot observations | 285,497 | item×arena-year | 2012–2025; positive amount; no within-key price conflict |
| Distinct items | 32,909 | item | Canonical MFDS item identifier |
| Distinct item×arena units | 40,957 | item×arena | Primary unit |
| Distinct ingredient–form arenas | 8,202 | arena | Full eligible history |
| Raw newly appearing item×arena observations | 18,496 | transition | Adjacent snapshots, 2013–2025 |
| Migration-in observations censored | 749 | transition | 717 also changed product code |
| Migration-censored appearance transitions | 17,747 | transition | Relative to preceding snapshot |
| Raw item×arena disappearances | 19,769 | transition | Adjacent snapshots, 2013–2025 |
| Migration-out observations censored | 6,366 | transition | 5,989 also changed product code |
| HIRA reimbursement delisting transitions | 13,403 | transition | After migration-out censoring |
| Panel B. Event eligibility and support | ||
|---|---|---|
| Metric | Count / support | Notes |
| Arenas in event registry | 8,077 | At least one evaluable transition |
| Never-event comparison candidates | 6,638 | No observed qualifying marker arrival |
| Never-event candidates lost after 2016 removal | 34 | No observation outside the removed endpoint |
| Never-event arenas in primary panel | 6,604 | Final comparison arenas after 2016 removal |
| Initial ±2 support ineligible | 813 | Observed marker but failed initial support |
| Initially eligible event arenas | 626 | Before 2016 removal and support recheck |
| Event year 2016 removed | 53 | Structural-recoding transition |
| Required support lost after 2016 removal | 206 | At least one of −2, −1, +1, +2 unavailable |
| Event arenas retained | 367 | Five cohorts, 2019–2023 |
| Panel C. Event semantics and common-support diagnostic | ||
|---|---|---|
| Metric | Count / support | Notes |
| First observed marker-event arenas | 1,439 | Before support restrictions |
| Single TOP-position product at first event | 129 | 9.0% of first marker events |
| More than one TOP product at first event | 1,310 | Complement of single-TOP-position-product events |
| More than one TOP entrant at first event | 452 | Multiple newly appearing top-price products |
| Eligible listing rows returning after a gap | 570 | 3.2% of 17,747 appearance rows |
| First events involving a returning TOP entrant | 43 | 3.0% of first marker events |
| Arenas with later recurrent top-price arrivals | 683 | 2,094 later marker-event arena-years |
| Common-support event arenas | 235 | Fixed cohorts 2020–2022; complete 2017–2025 |
| Common-support comparison arenas | 2,240 | No marker event observed in 2012–2025; same complete-calendar rule |
| Common-support estimation rows | 22,040 | Event year physically removed after eligibility check |
Note. The event is the first observed TOP-position arrival in the clean analytic window and does not identify actor type. “More than one TOP product” refers to the full arrival snapshot; “more than one TOP entrant” refers only to newly appearing products. Event time 0 and calendar year 2016 are physically absent from the primary event-study panel. Appendix A2 reports bridge and migration diagnostics; Appendix A3 reports event semantics, raw support, and the selected common-support risk set; Appendix A8 reports estimator-specific retention.
Comparison candidates and model comparisons have different denominators. The registry includes 6,638 arenas with no marker event observed during 2012–2025, but 34 are observed only at the removed 2016 endpoint. The primary event-study panel therefore contains 6,604 comparison arenas and 367 event arenas. Appendix A8 reports estimator-specific retention: fixed-effects reconciliations lose 599 arenas, and Poisson separation leaves only 44 T2 arenas and 175 T3 arenas.
Event semantics further bound the construct. The first marker event is observed in 1,439 arenas, but only 129 (9.0%) have a single TOP-position product in the full arrival snapshot; 1,310 therefore have more than one product tied at the TOP position. In 452 events, more than one newly appearing product itself occupies TOP. Across all eligible appearance rows, 570 (3.2%) are returns after an observed gap, and 43 first marker events (3.0%) involve such a returning TOP listing. After the first marker event, 683 arenas have at least one later TOP arrival, totaling 2,094 recurrent arena-years. These counts support the administrative event label and preclude treating it as a single, uniform originator action.
The tier-specific listing flows are extremely sparse and overdispersed. In the 43,798-row primary event-study panel, the mean T2 count is 0.0030, 99.893% of rows are zero, and the variance-to-mean ratio is 6.21. For T3 the mean is 0.0191, 99.498% are zero, and the variance-to-mean ratio is 21.45.
At event time −1, event arenas already average 0.030 T2 and 0.550 T3 listings, compared with pooled calendar-aligned comparison means of 0.003 and 0.015. Because event time −1 is the universal reference, negative post-event contrasts are compatible with normalization after an unusually elevated listing episode or selection on the reference-period base rather than deterrence. The sparsity does not explain away direction reversals or pre-event differences; it clarifies why count magnitude, extensive margin, and pre-event diagnostics must be reported together.
4.2 Temporal coding changes the apparent position pattern
The temporal-classification diagnostic precedes the tier-specific results. Of the 2,316 listing-appearance transitions in the paired-classification sample, 1,446 (62.4%) remain in the same arena and can be classified under both the historical and 2025 endpoint schemes. Among these matched transitions, 778 (53.80%) retain the same category. Table 2 separates the full historical result (A), the endpoint-matchable transitions classified at arrival (B), and those same transitions classified in 2025 (C).
<Table 2> Paired Historical and Endpoint Classification Diagnostic, Event Times +1 to +3
| Outcome | Full primary-panel historical A, estimate (p) | Matched historical B, estimate (p) | Same rows, endpoint C, estimate (p) | Direct C−B difference |
|---|---|---|---|---|
| T2 listing count | −0.0172 (.0369) | −0.0071 (.2409) | −0.0082 (.5491) | −0.0011; SE = 0.0139; 95% CI [−0.0283, 0.0261]; p = .9363 |
| T3 listing count | −0.5340 (.0236) | −0.3581 (.0805) | −0.0853 (.5696) | +0.2728; SE = 0.0879; 95% CI [0.1005, 0.4451]; p = .0019 |
Note. Model A uses all 2,316 listing-appearance transitions in the paired-classification transition sample. Models B and C use exactly the same 1,446 transitions that remain in the same arena and are classifiable in 2025. The B−A point-estimate difference reflects endpoint matchability and selective persistence; no standard error is claimed for that cross-model difference. Only C−B holds the listing-appearance rows fixed while changing classification time, and it is estimated directly as an arena-year difference outcome. It does not explain why classifications later differ, recover the unmatched 37.6%, or resolve endogenous event timing. Appendix A5 reports the full transition table and pre-event diagnostics.
For T2, the same matched transitions produce −0.0071 (p = .241) under historical classification and −0.0082 (p = .549) under endpoint classification. The directly estimated endpoint-minus-historical difference is −0.0011 (SE = 0.0139, 95% CI [−0.0283, 0.0261], p = .9363). Its local and wider pre-event joint-test p-values are .9712 and .5668. This small and imprecise point difference is not an equivalence result.
For T3, the matched historical association is −0.3581 (p = .080), whereas endpoint classification of the same transitions yields −0.0853 (p = .570). The directly estimated endpoint-minus-historical difference is +0.2728 (SE = 0.0879, 95% CI [0.1005, 0.4451], p = .0019). The difference outcome’s local and wider pre-event joint-test p-values are .1170 and .2108, although the classification-specific models retain problematic local diagnostics (p = .0167 and .0204). The paired result shows a numerically material temporal-coding difference among the matched transitions. It does not establish the direction of reverse causality or a corrected causal effect. The remaining listing results use arrival-snapshot classification unless endpoint classification is explicitly indicated.
4.3 Position-resolved administrative decomposition
Table 3 reports the position-resolved estimates, and Figure 1 displays the corresponding T2 and T3 dynamic paths. The baseline decomposition describes how the position-specific coefficients relate to the aggregate. Over event times +1 to +3, TOP-position listings rise by 0.5107 per arena-year (SE = 0.0986, p < .001). T1, T2, T3, and T4 estimates are −0.0562, −0.0172, −0.5340, and −0.0782, respectively. The sum of these position-specific coefficients equals the total-listing estimate of −0.1749 (SE = 0.2723, p = .521).
<Table 3> Position-Resolved Listing Associations and Pre-Event Diagnostics, Event Times +1 to +3
| Outcome | Estimate (SE) | p (unadjusted) | Local pre-event p | Wide pre-event p | Administrative result and inferential ceiling |
|---|---|---|---|---|---|
| TOP-position listing count | 0.511 (0.099) | <.001 | ― | ― | Arithmetic context; leads not estimable |
| T1 listing count | −0.056 (0.032) | .083 | .149 | .266 | Arithmetic context |
| T2 listing count | −0.017 (0.008) | .037 | .114 | .073 | Limited administrative association; definition-contingent |
| T3 listing count | −0.534 (0.236) | .024 | .019 | .026 | Opposite to originally predicted positive direction; pre-event rejection |
| T2, symmetric common support | −0.008 (0.009) | .420 | .734 | — | Selected late-cohort diagnostic; Holm post p = .420 |
| T3, symmetric common support | −0.185 (0.111) | .095 | .061 | — | Selected late-cohort diagnostic; Holm post p = .190; −3 simultaneous interval excludes zero |
| T4 listing count | −0.078 (0.038) | .042 | .004 | .001 | Arithmetic context; pre-event failure |
| Total listing count | −0.175 (0.272) | .521 | .010 | .036 | Arithmetic context; pre-event failure |
Note. Estimates are cohort-share-weighted associations in the selected evaluable administrative risk set. Position-specific coefficients sum to the total-listing coefficient, but this arithmetic decomposition is not a formal cross-position equality test. The primary comparison group is not-yet-event arenas, including arenas with no marker event observed during 2012–2025. The two common-support rows instead fix cohorts at 2020–2022, use only those never-observed-marker-event comparison arenas, and require complete 2017–2025 observation; they are a separate, selected administrative risk set. Event time −1 is the reference and 0 is absent. Joint lead tests are diagnostics rather than equivalence tests. Unless otherwise stated, p-values and pointwise intervals are unadjusted descriptive diagnostics. T2 and T3 are administrative categories, not validated values of relational proximity or direct tests of Propositions 1–2. Appendix A3 reports contributing cohort lists and total observed event-arena counts. Appendix A4 summarizes dynamic coefficients, pre-event diagnostics, and common-support results; Figure 1 displays the complete primary dynamic paths.
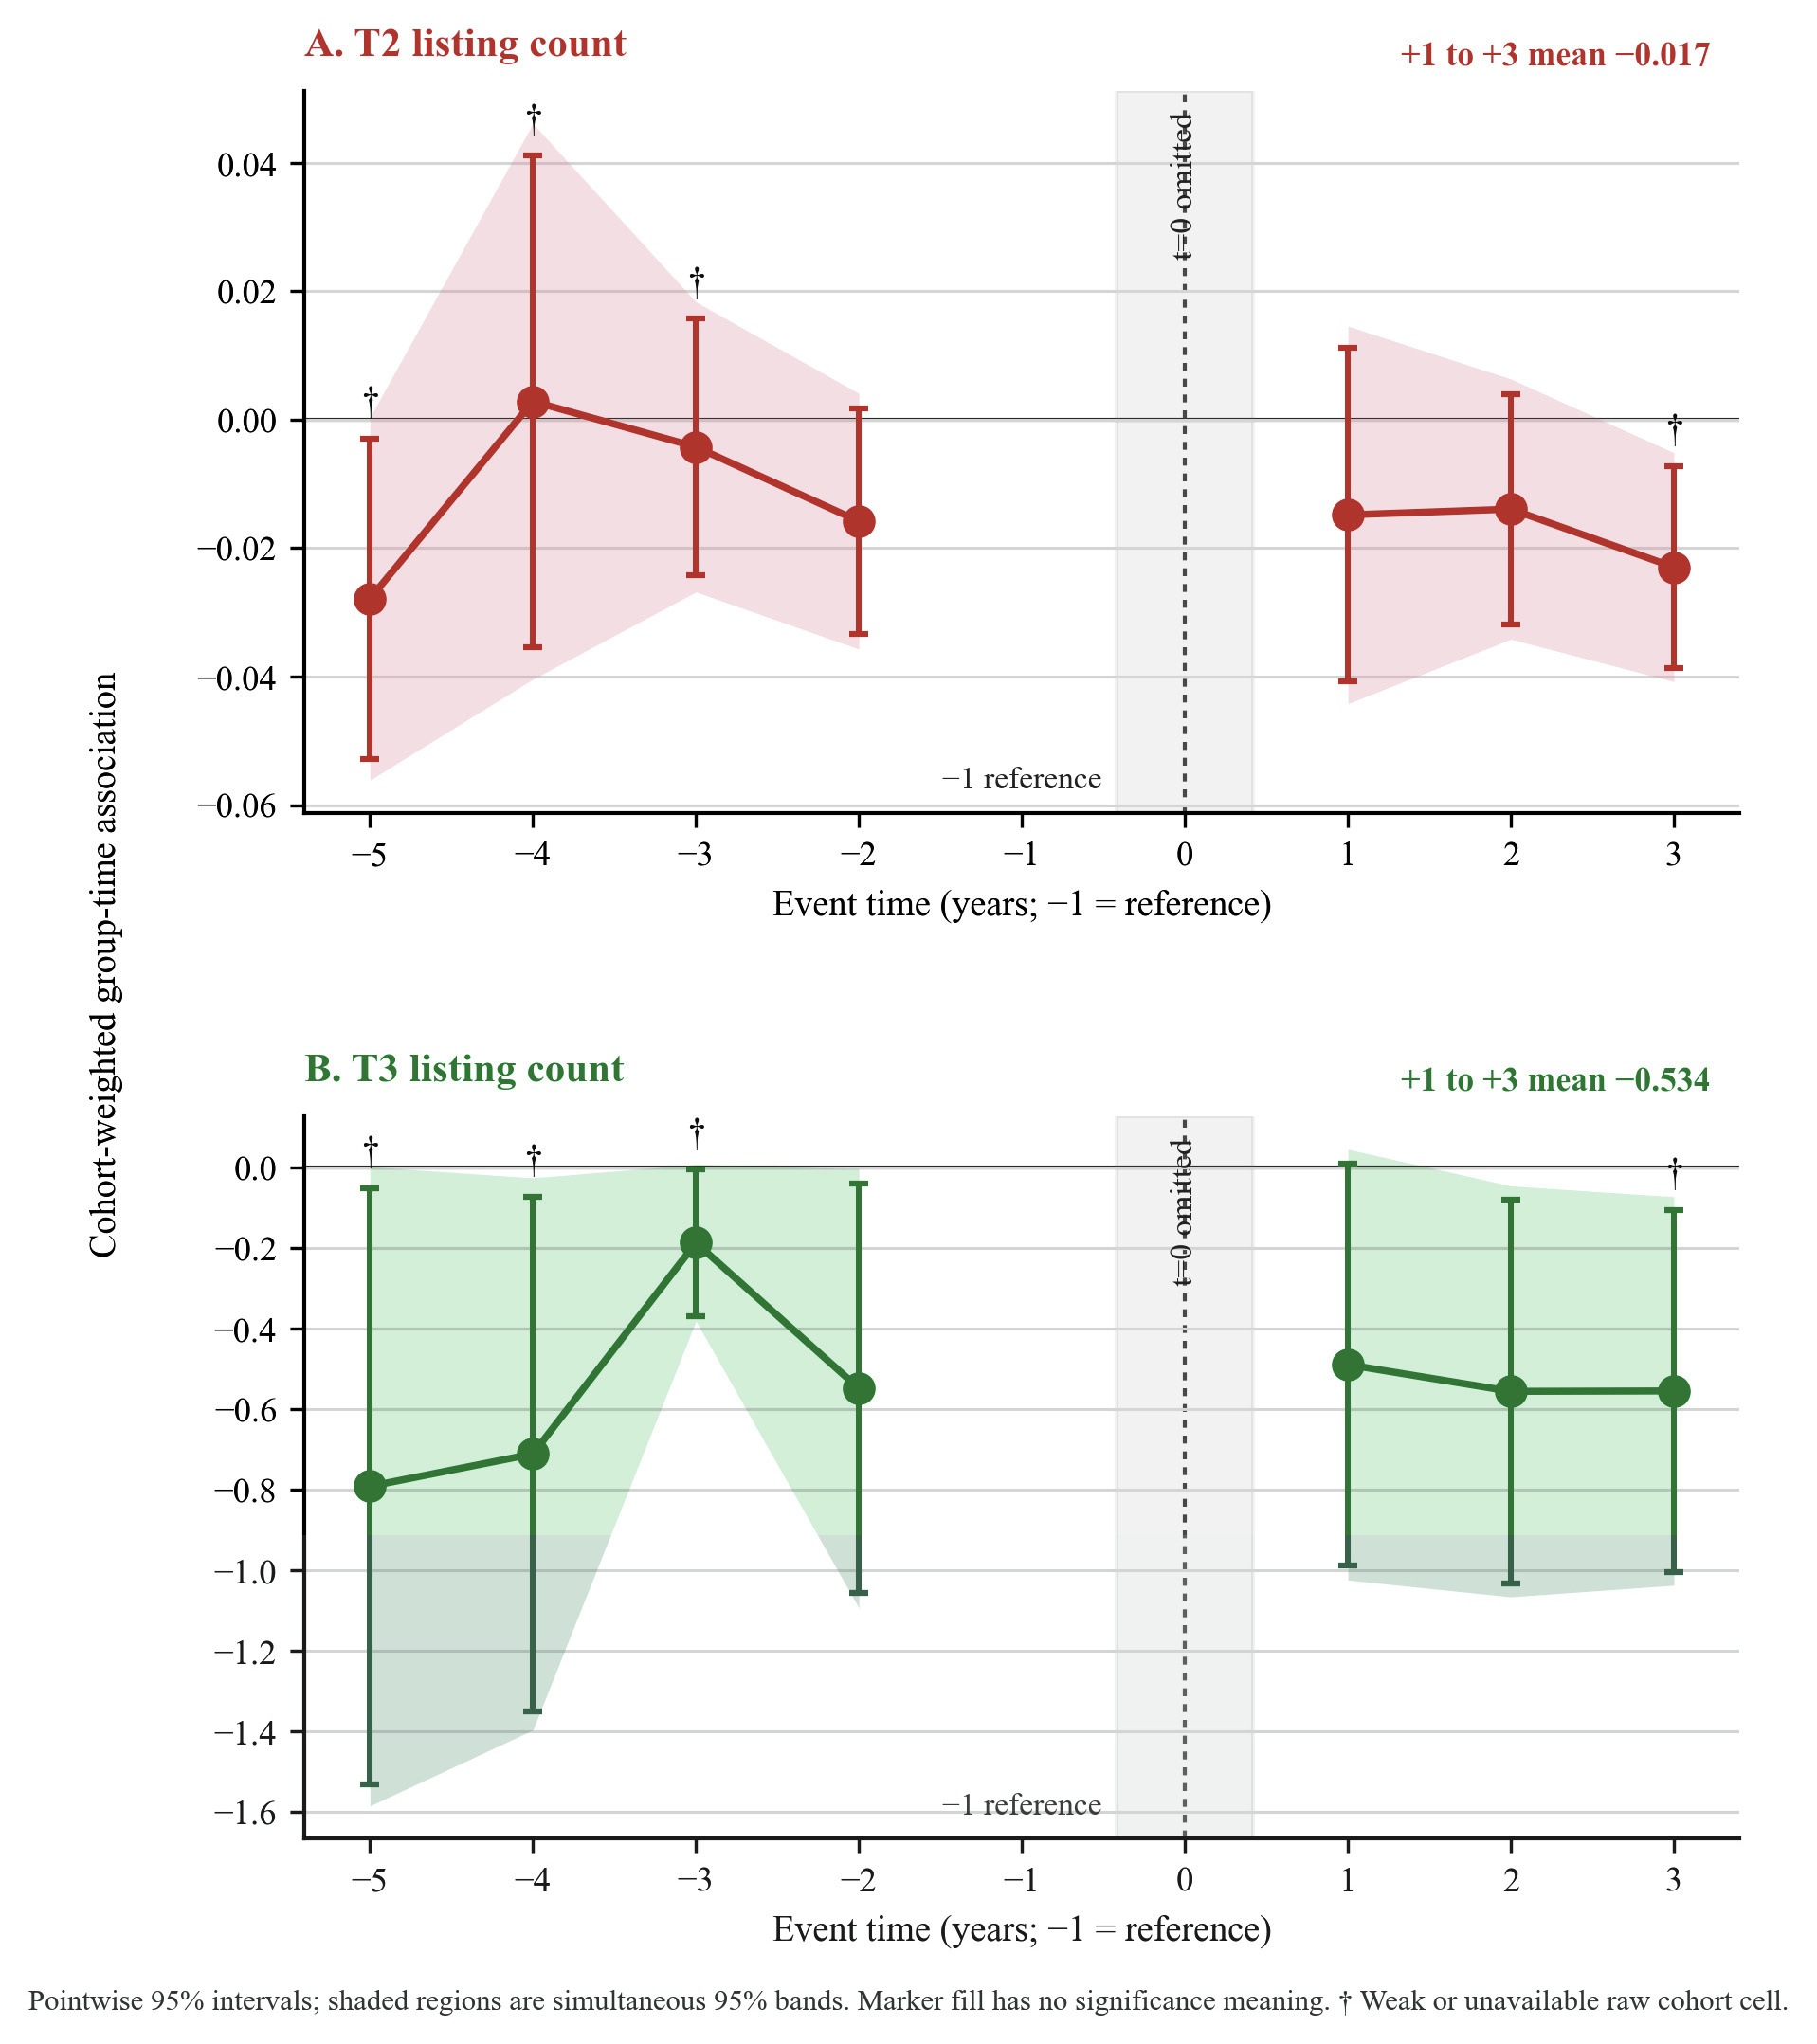
Note. Points are cohort-share-weighted event-time associations. Bars are pointwise 95% intervals, and shaded regions are simultaneous 95% bands. The upper panel reports the limited, definition-sensitive T2 administrative pattern; the lower panel reports the T3 path that does not support the originally predicted positive direction and has failed pre-event diagnostics. Neither panel directly measures relational competitive distance. The displayed analysis requires support through event time +3, so the 2023 cohort is excluded. Marker fill carries no significance coding. Daggers flag at least one weak or unavailable raw cohort cell. Event time −1 is the reference and 0 is absent. Appendix A3 reports the actual cohort composition and treated-arena contributions at each displayed event time.
The position-specific coefficients place the aggregate estimate in context. A positive TOP-position coefficient and negative non-TOP coefficients sum to a total-listing estimate that is not detectably different from zero, showing how an aggregate headcount can mask position-specific components. This arithmetic does not establish reallocation or constitute a formal test of equality across tiers. The TOP outcome lacks a usable joint lead test, while T3, T4, and total listings fail at least one pre-event diagnostic. The decomposition is therefore descriptive rather than a test of Propositions 1–2.
4.4 Definition-sensitive T2 administrative association
In the selected evaluable historical risk set, the T2 association over event times +1 to +3 is −0.0172 (SE = 0.0083, p = .0369). Unless a simultaneous or Holm procedure is named explicitly, p-values and intervals in this section are unadjusted descriptive diagnostics and do not determine the interpretive classification.
The local and wider pre-event joint tests yield p = .114 and .073. The nonrejections do not establish that the pre-event path is equivalent to zero: lead estimates use changing cohort composition, no equivalence margin was specified, and the wide vector has thin support.
The +1 to +5 and +4 to +5 averages are −0.0372 (p = .0166) and −0.0364 (p = .0148), but both use only the 2019 and 2020 cohorts, with 168 observed event arenas at +5.
Adjustment for predetermined size and momentum leaves the T2 coefficient negative (−0.0169, p = .0546), with local and wider pre-event p-values of .139 and .088. The adjustment does not, however, resolve the event-definition problem.
The common-support diagnostic preserves the negative direction but attenuates it to −0.0076 (SE = 0.0094, p = .420; Holm-adjusted p = .420; 95% CI [−0.0261, 0.0109]). Its joint test over event times −3 and −2 yields p = .734. Unlike the primary lead vector, every displayed event time contains all three 2020–2022 cohorts and all 235 event arenas. That design removes the original group-specific observability rule, but it does not validate a zero pretrend or create a representative comparison: the balanced late-cohort sample is observably selected on prior arena size and cohort.
Distinct focal-event definitions in the retrospective ten-row grid do not preserve the main T2 direction. Requiring the first-event arrival snapshot to contain a single TOP-position product produces a positive but imprecise +1 to +3 estimate (+0.0138, p = .521). Requiring the focal product to meet the preceding arena maximum yields a result descriptively close to zero (+0.00006, p = .992), without establishing equivalence. The 5/25/65 partition produces a larger negative association, while the 15/35/75 partition produces a smaller, imprecise negative estimate. As an auxiliary transition diagnostic, excluding calendar years 2016 and 2019 yields +0.0008 (p = .834) with only two cohorts.
The historical T2 association is limited and definition-contingent: its magnitude and sign vary with focal-event semantics and risk-set construction, and T2 is not a validated proximity measure. The prior-maximum result adds descriptive instability but does not establish equivalence.
4.5 T3 administrative association and failed pre-event diagnostics
The primary T3 association runs opposite to the originally predicted positive direction. The +1 to +3 average is −0.5340 (SE = 0.2358, p = .0236), the +1 to +5 average is −0.9650 (SE = 0.4572, p = .0348), and the +4 to +5 average is −0.9521 (SE = 0.4663, p = .0412). The local pre-event joint test rejects (p = .0185), and the wider test rejects (p = .0255). Estimates at event times −5 through −2 are already negative relative to −1, so the post-event contrast cannot be isolated from a different pre-event path.
The single-TOP-position-product and prior-maximum event restrictions yield positive but statistically imprecise +1 to +3 estimates (+0.0855, p = .255; +0.0108, p = .564). Excluding calendar years 2016 and 2019 yields +0.1058 (p = .464) with two cohorts. Alternative cutoffs retain the main negative direction and failed pre-event tests; code-level and stable-unit estimates are negative, smaller, and less precise.
In the common-support diagnostic, the T3 association remains negative but attenuates to −0.1848 (SE = 0.1107, p = .095; Holm-adjusted p = .190; 95% CI [−0.4019, 0.0323]). The joint test over event times −3 and −2 yields p = .061.
The event-time −3 estimate is −0.2238 (pointwise p = .042; 95% simultaneous interval [−0.4458, −0.0018]), although its Holm-adjusted p across the two administrative outcomes at that event time is .084. A simultaneous pre-event interval therefore excludes zero even though the two-lead joint p-value is just above .05. The selected balanced risk set neither establishes parallel pre-event paths nor provides a causal repair.
The current implementation does not support the originally predicted positive T3 direction. Positive estimates from restricted samples are imprecise and cohort-limited, while the negative primary association has failed lead diagnostics and uses a category not validated as relational distance. Neither pattern identifies a shadow or another adverse mechanism.
4.6 Definition and common-support sensitivity
Table 4 and Figure 2 present the retrospective ten-specification grid for marker, event, unit, and bridge definitions. The T2 definition sensitivities complement the focal-event comparisons above. The 5/25/65 partition produces −0.073, the 15/35/75 partition produces −0.015, code-level counting yields −0.013, requiring a revised-product-code bridge in every observed snapshot yields approximately zero, and a single-arena restriction produces −0.042. The predetermined size-and-momentum adjustment remains an auxiliary diagnostic outside the grid, reported in Appendix A11. Transition-year, comparison-group, common-support, and matched endpoint-classification diagnostics are likewise separated from the ten rows.
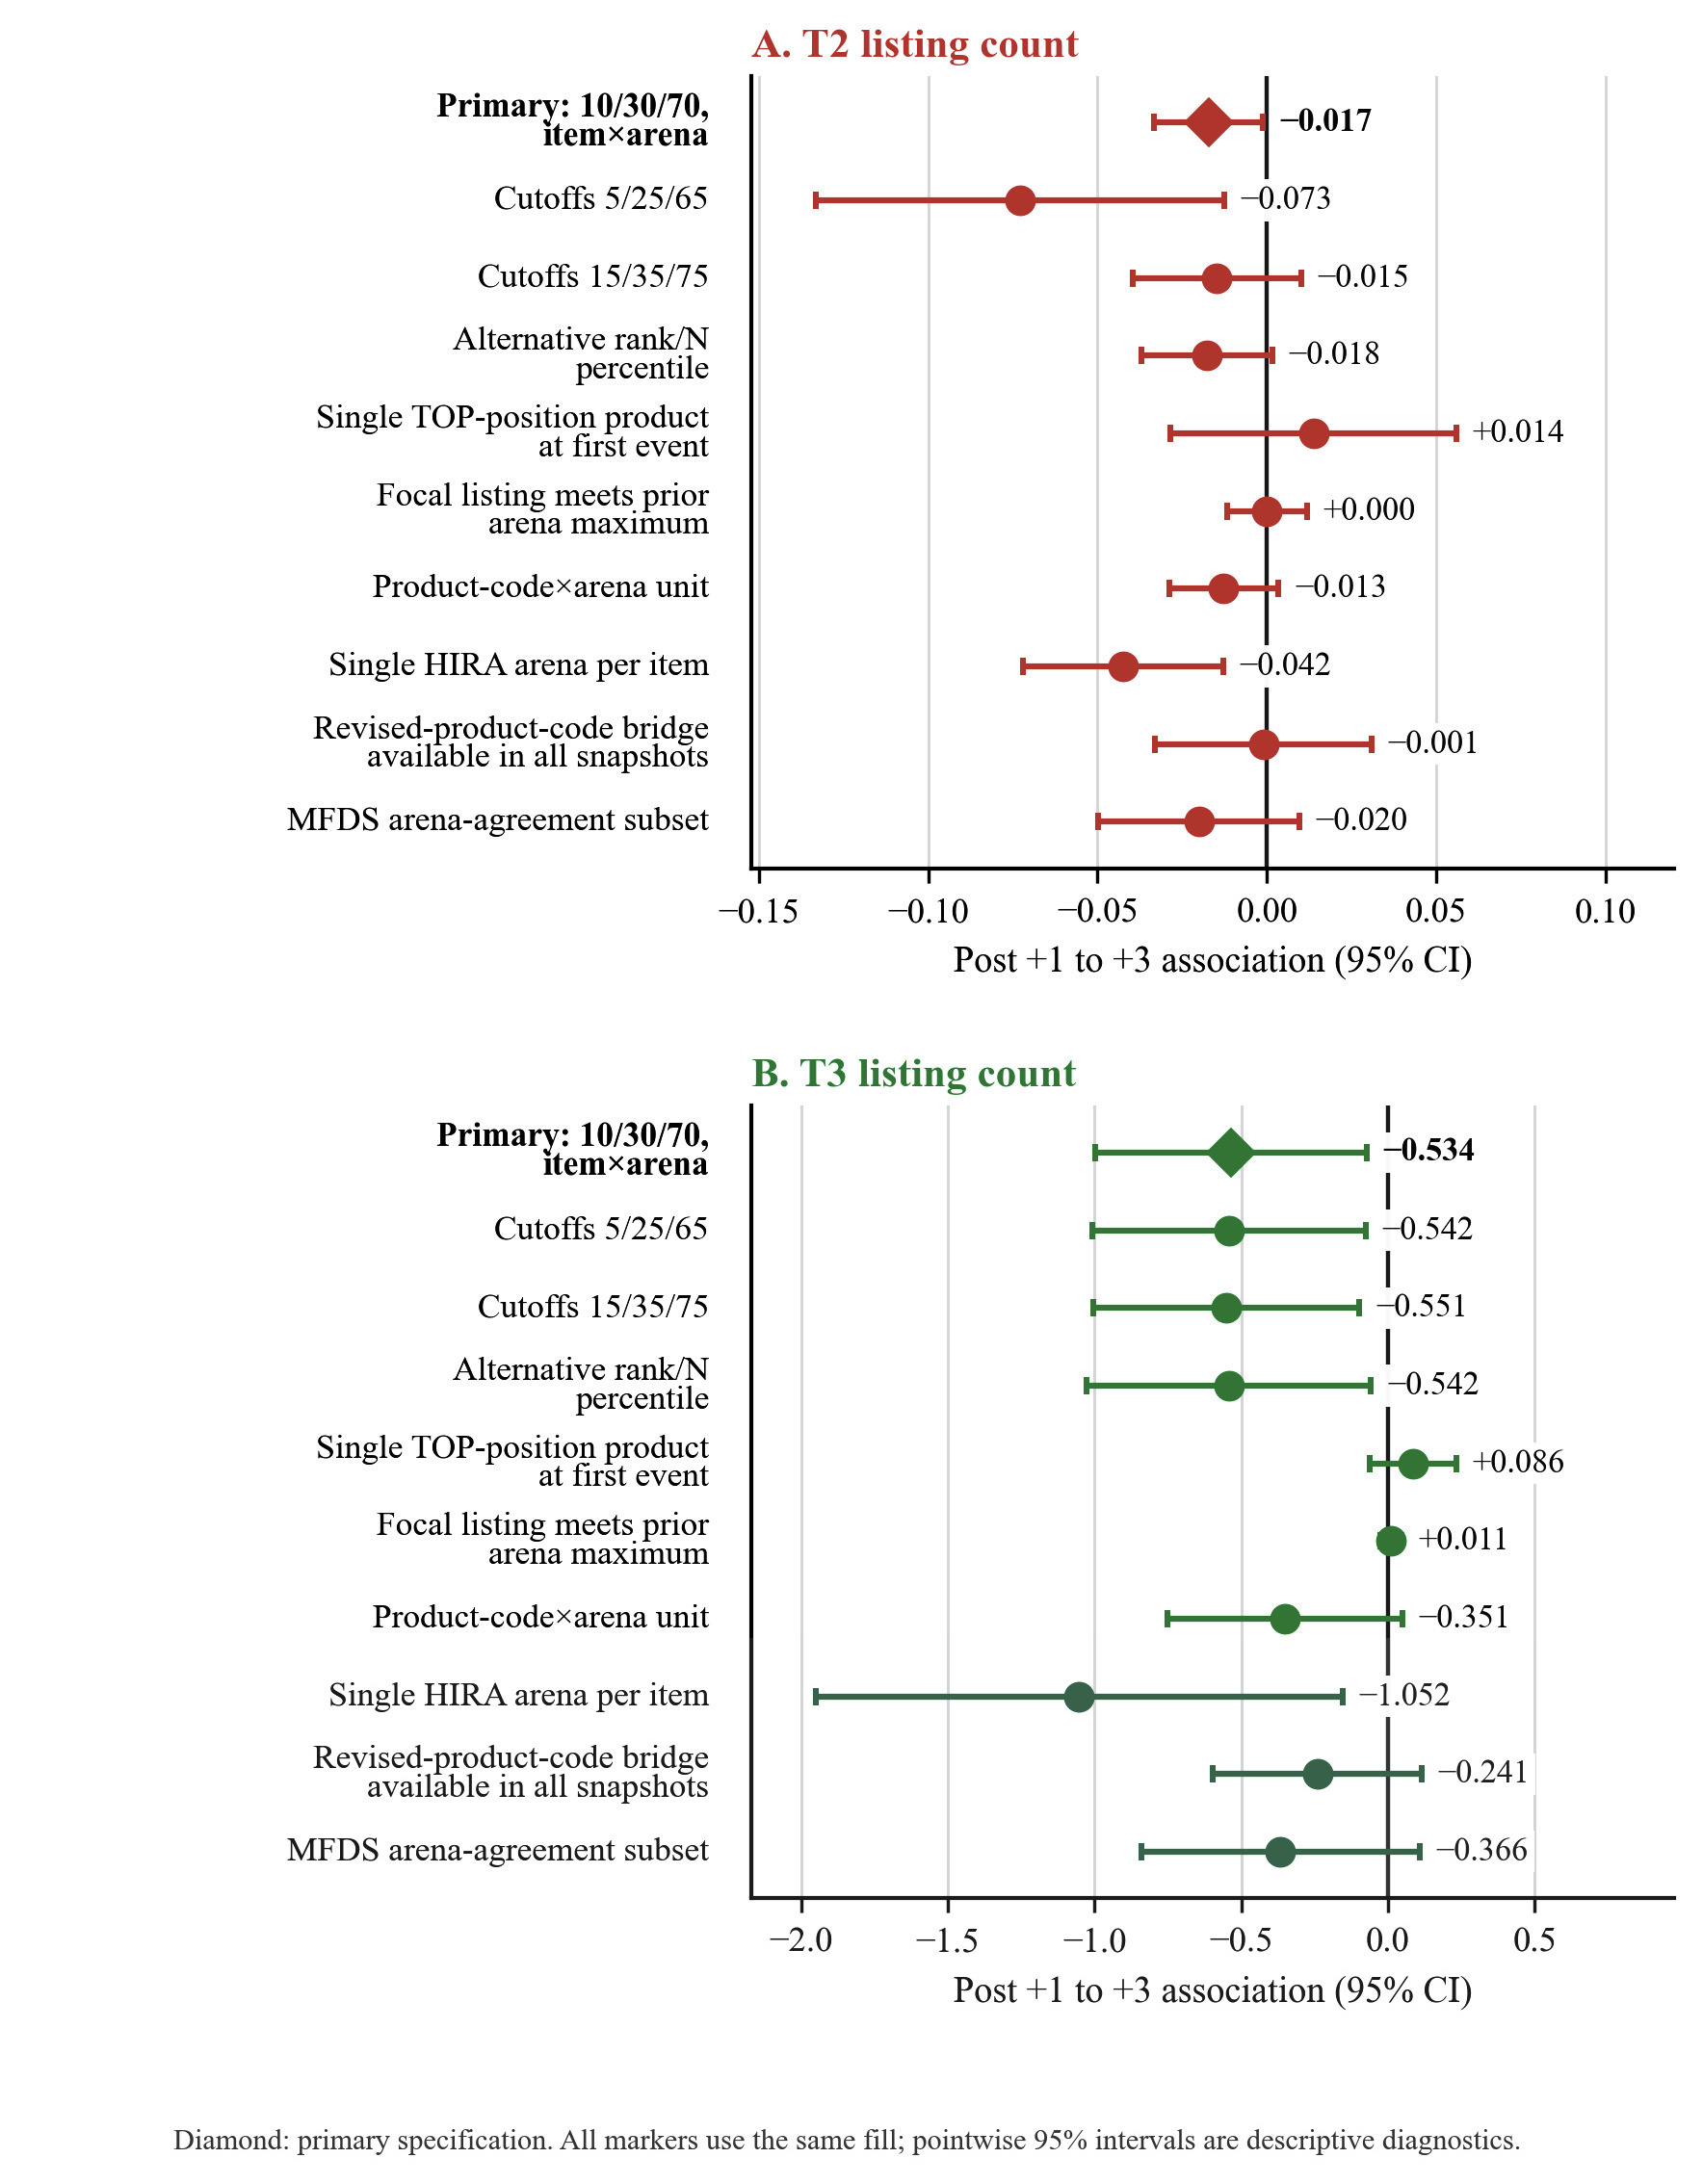
Note. Points show +1 to +3 cohort-share-weighted associations with pointwise 95% intervals. The display is a retrospective definition-sensitivity map: the negative T2 association is limited and definition-contingent, and the originally predicted positive T3 direction is not supported. Intervals characterize uncertainty and do not select a preferred model or produce a confirmatory verdict. Marker fill carries no significance coding. T2 and T3 are reimbursement-rank bins, not measures of shadow or spotlight.
For T3, alternative cutoffs remain near −0.54 to −0.55 with rejected pre-event tests. Code-level, revised-product-code-bridge-available, and HIRA–MFDS arena-agreement restrictions attenuate the negative estimates. Requiring a single TOP-position product in the first-event arrival snapshot produces a positive but imprecise value, while prior-maximum produces an estimate close to zero. These nonexchangeable specifications are interpreted qualitatively, not as a sign vote. They leave the T2 classification definition-contingent and the originally predicted positive T3 direction unsupported.
Linear fixed-effects and Sun–Abraham estimates are generally negative for both outcomes, but their lead coefficients do not show a clean pre-event pattern. Poisson estimates offer little stability evidence because they retain only 44 T2 arenas and 175 T3 arenas. Appendix A8 reports estimator retention, and Appendix A12 distinguishes the retrospective and supplementary diagnostics.
4.7 HIRA delisting and MFDS cancellation
The three administrative departure outcomes―HIRA delisting, persistent delisting, and MFDS cancellation—provide no coherent tier-specific corroboration. For prior-T2 incumbents, the +1 to +3 associations are −0.0014 (p = .762), +0.0015 (p = .722), and +0.0012 (p = .387), respectively. For prior-T3 incumbents, they are −0.0075 (p = .692), −0.0120 (p = .489), and +0.0040 (p = .548).
The endpoints differ institutionally, estimates are imprecise, and wider pre-event tests reject for all three T3 endpoints. Detailed results and the descriptive event-time −1 landmark are reported in Appendix A9–A10. The evidence does not identify commercial survival, sequential crowding, or market exit.
Ⅴ. Discussion
5.1 What the temporal-classification diagnostic establishes
The clearest empirical result concerns when administrative position is measured. Among the same 1,446 endpoint-matchable listing-appearance transitions, replacing arrival-snapshot T3 with 2025 T3 changes the post-window association by +0.2728 (p = .0019), while the paired T2 change is small and imprecisely estimated. Only 53.80% of matched transitions retain the same category, and only 62.4% of the 2,316 transitions in the paired-classification sample are endpoint-matchable. The finding is therefore a T3 reclassification result among matchable transitions, not a general estimate for all historical appearances. It sits within the broader accounting of reclassification and selective persistence.
The paired result leaves the cause of later rank changes and the direction of reverse causality unresolved, and it does not validate historical rank as relational proximity. Its narrower implication is clear: endpoint rank is not a predetermined historical position. Arena membership and reimbursement rank must be calculated within each dated snapshot before the marker receives strategic meaning.
5.2 Claim ceilings in archival strategy research
The five-link rule specifies how far the administrative evidence can travel. Historical reconstruction strengthens temporal warrant, but focal-actor identity, relational-marker validity, strategic-outcome meaning, and exogenous event timing remain unverified. The present claim therefore stops at a historically aligned marker-level association. Table 5 shows how each link sets that boundary.
<Table 5> Theory-to-Evidence Links and the Admissible Claim Boundary
| Panel A. Role of the claim-admissibility rule | |||
|---|---|---|---|
| Approach | Primary question | What remains separate | Role of the five-link rule |
| Construct–measure validity | Does an observation represent a construct? | Event actor, historical risk set, endpoint semantics, and counterfactual may be outside one measurement model | Maps every required translation to the exact claim |
| Archival-proxy critique | Is an archival field defensible for the construct assigned to it? | Strong design at another link can still be mistaken for proxy validation | Forbids cross-link substitution |
| Event-study identification | Does the coded event-time comparison support the stated contrast? | The estimator takes the coded actor, marker, and outcome as inputs | Applies a semantic gate before causal interpretation |
| Five-link claim-admissibility rule | What is each field warranted to mean, and what comparison is warranted? | Warrant may be absent, partial, or sufficient | Returns the maximum admissible empirical claim |
| Panel B. Present application | |||
|---|---|---|---|
| Link | Warrant state for latent spillover claim | Evidence boundary | Claim-ceiling action |
| Actor | Absent | Top-price arrival does not verify originator, dominance, or salience | Use “top-price listing arrival” only |
| Marker | Absent | Reimbursement rank is not validated against relational overlap | Use “administrative price position” only |
| Temporal | Partial | Historical alignment is established within 2012–2025; pre-2012 history remains left-censored | Limit timing claim to the observed window |
| Outcome | Absent for strategic response; sufficient for list status | Appearance, delisting, and cancellation are administrative endpoints | Use endpoint-specific administrative verbs only |
| Identification | Absent for causality; partial for selected association | Endogenous timing, lead concerns, and selected support remain | Report selected cohort-weighted associations only |
| Claim-specific premises (when invoked) | Absent | No rivalry-pressure, category-expansion, identity, or sequential-mediator measure | Make no shadow, spotlight, identity, or crowding mechanism claim |
Note. Panel A distinguishes the rule by its decision function rather than claiming five new validity labels. Panel B applies absent/partial/sufficient warrant to the exact latent spillover claim. Claim-specific premises are not a sixth universal link; they enter $J(K)$ only when the target statement names a mechanism that requires them. Within-link evidence can narrow uncertainty; evidence for one link cannot establish another. The T2 and T3 classifications are retrospective administrative diagnostics. The present study does not evaluate Propositions 1–2.
An example shows how the rule changes the admissible claim. A coefficient-first reading might say, “originator entry suppresses T2 rivals.” That sentence is not admissible because actor identity, relational proximity, strategic behavior, and causality are unverified. The supported statement is narrower: “Within the selected evaluable historical HIRA risk set, T2 reimbursement-list appearances are negatively associated with a first observed TOP-position arrival, but the magnitude and direction are sensitive to event definition and support.” The five-link rule prevents the marker from carrying meanings the data do not establish.
The rule connects established approaches through a common claim-admissibility decision. Construct–measure scholarship supplies correspondence logic (Adcock and Collier, 2001; Edwards and Bagozzi, 2000; Godfrey and Hill, 1995); archival-proxy work exposes field-to-construct mismatch (Boyd et al., 2005); relational strategy theory makes competitive distance pair-specific (Chen, 1996); and event-study methods discipline the comparison once event, outcome, and risk set have been coded. The five-link procedure specifies the evidentiary bridge required before those inputs can carry the higher-level strategy claim.
5.3 The shadow–spotlight threshold as a motivating benchmark
The threshold model organizes the shadow–spotlight account around the relative strength of expansion and localized pressure. Localized pressure and market expansion may coexist, and their relative magnitude determines all-shadow, all-spotlight, or mixed regimes. Propositions 1–2 further show how an action or market attribute moves the boundary depending on whether it strengthens expansion or localized pressure more strongly. This formulation preserves the original intuition that a focal market action can have heterogeneous competitive consequences while making its comparative statics explicit.
The present application does not measure relational proximity $P_{im}$, expansion $E_{m}(a)$, or competitive pressure $C_{m}(P_{im}, a)$. It therefore does not evaluate Propositions 1–2, and no theory verdict follows from the T2/T3 associations. What the application evaluates is whether the original administrative implementation can reach that inferential level. It cannot: T2 shows a limited, definition-contingent negative marker association, while T3 does not display a diagnostically credible positive association. These conclusions concern administrative position bins. They are neither verdicts on the theoretical propositions nor evidence that all competitors experience suppression.
5.4 What would be required to name the mechanism
Current data do not support an identity interpretation. Rejecting one price explanation would not establish identity as the alternative, and the analysis has no direct measures of detailing, reputation, formulary access, physician attention, or actor recognition. The 2012 pricing reform is a broad institutional change with exceptions and contemporaneous industry developments, not a substitute for the missing identity measure.
Sequential crowding likewise remains unidentified. Conditioning on a T3 stock measured after the focal event could block an event-related path, induce post-event selection, or describe arenas in which T2 appearances were already less likely. A causal sequential account would require pre-event pipeline measures, independently timed supply variation, or another design that separates the proposed stages.
The departure outcomes reinforce this boundary: HIRA delisting and MFDS cancellation are institutionally distinct and display no coherent tier-specific pairing. Without sales or distribution data, neither can be translated into commercial survival or competitive displacement.
5.5 Administrative and managerial use of the claim ceiling
For competitive intelligence and policy analysis, the claim ceiling identifies the evidence required for each step toward a strategic interpretation. Without actor identity, the description stops at a TOP-position arrival; without relational overlap, at reimbursement-rank bins; without outcome or identification warrant, at selected administrative associations. Naming shadow or spotlight regions requires all of those links. Analysts must therefore preserve dated product risk sets, distinguish applications, reimbursement listings, regulatory cancellations, and commercial activity, and report cutoff and support dependence.
Managers can use reimbursement rank to summarize an administrative position, but not as a sufficient statistic for rivalry. A competitor map based only on rank can overlook asymmetric market commonality, resource similarity, formulary access, physician adoption, patent position, and firm pipelines. The validity chain identifies which additional evidence is needed before an administrative score can support a strategic inference.
5.6 Limitations and additional data
The temporal reconstruction has three limitations. First, no 2011 HIRA snapshot is available, so the analysis cannot reconstruct every transition surrounding the 2012 reform. The 2009 code system is also outside the primary bridge. Second, annual snapshots interval-censor appearances and disappearances; event time 0 is absent because ordering within the annual interval is unknown. Third, the 2016 recoding wave creates a tradeoff between transition contamination and cohort support.
The event definition and support rules impose further limits. The event is first observed only within the clean analytic window and may be left-censored. Among 17,747 eligible appearance transitions, 570 are returns after a gap. Of 1,439 first observed marker events, only 129 arrival snapshots contain a single TOP-position product; 452 contain more than one newly appearing TOP product, and 43 involve a returning TOP listing. A further 683 arenas have 2,094 later recurrent TOP-arrival arena-years. These counts make first observed TOP-position arrival a bounded administrative event, not a verified first-ever originator action.
Eligibility also conditions on arena observability through +2. Of observed TOP-position arrivals, 813 fail the initial support rule and 206 more lose support after 2016 is removed. Because absent arena-years are not imputed as zero, the reported associations apply only to the selected evaluable administrative risk set.
Current public reference-drug or patent-linkage fields could improve actor classification for a subset, but they would not establish perceived identity or market dominance for every historical event.
The analysis also lacks reimbursement applications, development pipelines, prescriptions, sales, detailing, formulary placement, and physician-level adoption. Application data could separate firm submission from administrative acceptance. Claims or prescription data could evaluate demand changes and validate overlap. Patent and reference-drug histories could improve actor classification. Private detailing, formulary, or reputation measures would be needed to evaluate an identity channel. Pre-event pipeline information or credible external timing variation would be required for a sequential-crowding design.
A direct test of the threshold model would require independently verified focal-actor histories, dyadic demand or strategic-overlap measures for $P_{im}$, dated category-expanding activity for $E_{m}(a)$, outcomes corresponding to $R_{im}(a)$, and event timing or comparison variation capable of supporting the intended counterfactual.
Population and time boundaries further limit generalization. Eligible event cohorts are concentrated in 2019–2023 after the 2016 transition is removed, but the primary balanced +1 to +3 estimand uses only 2019–2022. The 2016 gap changes cohort composition across the primary lead vector, and long post windows use only the 2019 and 2020 cohorts. A stricter diagnostic fixes cohorts at 2020–2022 and complete observation at 2017–2025, but retains only 235 event arenas and 2,240 comparison arenas with no marker event observed during 2012–2025 and is observably selective. Endpoint-price matching covers only 62.4% of listing-appearance transitions in the paired-classification transition sample. Neither diagnostic restores population representativeness. The results should not be generalized automatically to earlier Korean institutional periods or to pharmaceutical systems with different reimbursement and prescribing arrangements.
Ⅵ. Conclusion
This study asks when administrative records can support claims about competitive spillovers. The threshold model treats shadow and spotlight as conditional regions separated by the relative strength of arena-wide expansion and localized pressure, but the application does not test whether an originator entry creates either region.
In Korean HIRA data, endpoint classification combines selective persistence with substantial reclassification. Among matched transitions, it materially changes the T3 association, while the T2 point difference is small and imprecisely estimated. With positions reconstructed at arrival, the T2 association remains definition-sensitive and T3 does not yield a diagnostically credible positive pattern. The evidence therefore supports claims about time-indexed reimbursement-list positions, not competitive mechanisms. Archival strategy research should establish actor, marker, time, outcome, and comparison before naming the mechanism.
Generative AI Disclosure. Generative AI tools were used for code assistance, manuscript formatting, and language editing. The author takes full responsibility for all data construction, statistical specifications, analytical decisions, source verification, and interpretation.
Appendix
This appendix reports the evidence for a worked administrative measurement audit. It documents historical reconstruction, event support, the paired temporal-classification diagnostic, the TOP–T4 arithmetic decomposition, retrospective T2/T3 sign checks, and administrative departure outcomes. Primary estimates use the historically reconstructed data. Supplementary analyses added common-support, stable-cohort, endpoint-pairing, sparsity, and event-semantic diagnostics after reproducing the two primary T2/T3 models; they did not independently rerun the other eight rows of the retrospective definition-sensitivity grid. Results describe reimbursement-list patterns around an endogenous administrative TOP-position marker.
The shadow–spotlight threshold is a motivating benchmark, not the object estimated here. The present data do not verify the focal actor, strategic salience, pairwise competitive distance, strategic response, mechanism, or causal counterfactual. The originally predicted negative T2 and positive T3 directions serve only as benchmarks for retrospective checks of the original marker coding.
The negative T2 association is classified as limited and definition-contingent because its primary estimate reverses under a distinct focal-event definition, approaches zero under another, and attenuates under common support. The originally predicted positive T3 direction is not supported in the present implementation because its primary estimate is negative and its pre-event diagnostics raise design concerns. These are administrative-marker classifications, not hypothesis verdicts. P-values and intervals describe uncertainty; no confirmatory family or ex ante decision rule is claimed.
A1. Historical Sources, Data Parsing, and Snapshot-Level Quality Control
Historical price positions are reconstructed from contemporaneous HIRA reimbursement snapshots rather than inferred from a current product list.
The source archive contains 16 HIRA workbooks covering 2009, 2010, and 2012–2025. The parser scanned 441,335 worksheet rows and retained 317,119 rows with positive listed reimbursement amounts. Product-code and ingredient/form-code completeness is 100% among retained rows, and all 16 structural parser checks pass. The main analysis uses 2012–2025 because the 2009 file uses legacy alphanumeric codes and no 2011 snapshot is available. The nonannual 2010-to-2012 interval is not treated as a one-year transition.
Headers were matched after Unicode normalization and collapsed whitespace using exact aliases. Ingredient/form codes were filled only within the same snapshot; no later HIRA value, current MFDS arena, or future crosswalk filled a historical arena. The 2016 workbook required a specific correction because substring matching had confused 제품코드 with 목록정비전 제품코드. Exact aliases preserve both fields. The corrected 2016 snapshot contains 20,425 positive-price rows and 100% valid current product codes.
Every parsed row retains its snapshot date, source file, worksheet, source row, contemporaneous arena, current/old/pre-cleanup code fields, product and company names, specification, unit, and listed reimbursement amount. This row-level record makes apparent additions or disappearances auditable against the original workbook. The 2010 file remains useful for code diagnostics, but the missing 2011 observation prevents its use as an annual baseline for 2012.
The linked MFDS standard-code master contains 305,522 package/standard-code records and 96,220 valid nine-digit authorization items. Permit and cancellation dates are attached only after an item bridge is established.
HIRA presence measures reimbursement-list status at a snapshot, not sales, prescribing, distribution, transaction price, or exact commercial entry. Within the observed 2012–2025 snapshots, the reconstruction avoids conditioning the risk set on survival into a current master; it does not recover unobserved pre-2012 histories or products absent from every archived snapshot. Annual appearance and disappearance remain interval-censored between adjacent snapshots.
A2. HIRA–MFDS Bridge, Item-by-Arena Canonicalization, and Migration Audit
The bridge and canonicalization audit documents item identity, historical arena assignment, and the treatment of products observed under multiple codes or arenas.
The bridge takes the union of candidate MFDS items from the post-cleanup product-code field and digits 4–12 of the representative and standard barcodes. A HIRA code is retained only when that union identifies exactly one authorization item; no arbitrary precedence rule resolves a one-to-many match. The primary key is MFDS item × contemporaneous HIRA arena × snapshot.
The bridge contains no within-item conflicts in linked MFDS permit or cancellation dates and no code-by-arena-by-snapshot price conflicts. Conservative normalized-name comparison shows mutually containing HIRA/MFDS names for 96.5% of standard-barcode-only historical rows. Name agreement supports the aggregate bridge audit but is not used as a discretionary key to force unmatched or ambiguous codes into the panel.
<Table A2> Bridge, canonical panel, and transition reconciliation
| Domain | Measure | Value | Audit interpretation |
|---|---|---|---|
| Bridge | Distinct HIRA codes | 44,345 | 2012–2025 window |
| Bridge | Unique HIRA–MFDS bridges | 44,253 (99.793%) | Row-weighted coverage 99.888% |
| Bridge | Ambiguous codes / affected rows | 2 / 17 | Excluded rather than forced |
| Bridge | Unmatched codes / affected rows | 90 / 304 | Excluded rather than forced |
| Historical arena | Invalid arena-code rows | 43 | Not backfilled from current MFDS arena |
| Canonical panel | Eligible records | 285,497 | Item×contemporaneous-arena×snapshot |
| Canonical panel | Items / item×arena units / arenas | 32,909 / 40,957 / 8,202 | Primary historical risk set |
| Canonical panel | Within-key price conflicts excluded | 295 | Nonidentical positive amounts |
| Cross-arena audit | Cross-arena items | 4,376 | 1,968 concurrent; 2,408 sequential |
| 2015–2016 audit | Code-linked arena switches | 2,315 / 2,365 | Administrative recoding concentration |
| Appearance flow | Raw / migration-in / eligible | 18,496 / 749 / 17,747 | Reimbursement-list appearances |
| Disappearance flow | Raw / migration-out / eligible | 19,769 / 6,366 / 13,403 | HIRA reimbursement delistings |
The row-count funnel is closed as follows. Of the 317,119 positive-price rows parsed from all 16 workbooks, 287,914 fall in 2012–2025. Excluding 43 invalid historical-arena rows and 321 rows attached to ambiguous or unmatched codes leaves 287,550. Applying the documented item-by-arena-by-snapshot canonicalization rule reduces this count by a net 1,758 code-level rows, and removing 295 within-key price-conflict rows yields 285,497 eligible canonical records. The 31,622-row difference from 317,119 to 285,497 therefore combines the 29,205 rows outside the primary years with these explicitly reconciled bridge, canonicalization, and conflict steps.
The sequential-transition reconstruction contains 2,434 arena transitions, 2,252 of which arrive in 2016. A separate code-linkage audit examines 2,365 arena switches across the 2015–2016 boundary and links 2,315 through an unchanged current code or an explicit pre-cleanup code. In 2016 alone, 3,877 of 4,344 raw disappearances are migrations. This concentration motivates the transition exclusion rather than a claim of market exit.
Current MFDS arena information is a concordance check, not a historical replacement. Cross-arena items are not deleted globally; migration boundaries are censored and stable-unit restrictions are reported separately.
The listing outcomes used below are flows of newly appearing reimbursement listings between adjacent snapshots. A newly appearing item is classified by its contemporaneous position in the listing snapshot. These counts are not a reassignment of continuously listed incumbents across price tiers, and they do not measure a redistribution of an incumbent stock.
A3. Event Registry, Cohort Support, and Drop Reasons
The event-risk-set audit defines eligibility and records every support loss caused by the event-year and 2016 exclusions.
A qualifying event is the first observed transition in which an established arena receives a migration-censored product newly appearing relative to the preceding annual snapshot at the contemporaneous TOP position. Initial eligibility requires observations at g−2, g−1, g+1, and g+2. An ineligible event is excluded, never relabeled as untreated. Event time 0 is physically absent because the focal and same-snapshot listings cannot be temporally ordered. Calendar year 2016 is also physically absent from the primary transition clock; events occurring then are not retimed.
The final event cohorts contain 70 arenas in 2019, 104 in 2020, 127 in 2021, 45 in 2022, and 21 in 2023. The 2023 cohort’s +1 and +2 observations do not enter the +1…+3 aggregate because +3 is unavailable. A removed 2016 calendar cell changes the cohort set across leads; unavailable cells remain unavailable rather than being imputed.
<Table A3a> Event-risk-set funnel
| Stage | Arenas | Disposition |
|---|---|---|
| Event registry | 8,077 | At least one evaluable transition |
| Never-observed-marker-event candidates | 6,638 | Software label: never-event; 34 have no usable non-2016 row |
| Final comparison arenas | 6,604 | Primary comparison risk set |
| Marker events without initial support | 813 | Excluded, not relabeled as untreated |
| Initially eligible marker events | 626 | Before transition and support recheck |
| Event year 2016 | 53 | Physically removed, not retimed |
| Support lost after 2016 removal | 206 | Required −2,−1,+1,+2 cell unavailable |
| Final event arenas | 367 | Cohorts 2019–2023 |
| Final model panel | 6,971 arenas / 43,798 rows | 367 event + 6,604 comparison arenas |
<Table A3b> Raw support and balanced displayed-dynamics contribution
| Event time | Raw event-arena support | Balanced contributing cohorts | Observed event arenas |
|---|---|---|---|
| −5 | 95 | 2019, 2020, 2022 | 79 |
| −4 | 187 | 2019, 2021, 2022 | 170 |
| −3 | 278 | 2020, 2021, 2022 | 259 |
| −2 | 367 | 2019–2022 | 346 |
| +1 | 367 | 2019–2022 | 346 |
| +2 | 367 | 2019–2022 | 346 |
| +3 | 344 | 2019–2022 | 344 |
| +4 | 292 | 2019–2020 for long window | ― |
| +5 | 168 | 2019–2020 for long window | 168 |
To address the asymmetric future-observability concern directly, the supplementary symmetric-support diagnostic fixes event cohorts at 2020–2022, uses comparison arenas with no qualifying marker arrival observed during 2012–2025, and requires every event and comparison arena to be observed in all original outcome-skeleton years from 2017 through 2025. Event year 0 is then removed rather than imputed. Of 276 initially eligible event arenas in these cohorts, 235 satisfy the common support rule (96/111/28 in 2020/2021/2022); 2,240 of 6,638 never-observed-marker-event candidates do so. The resulting selected panel contains 2,475 arenas and 22,040 arena-years.
This restriction changes the estimand from the primary, unbalanced not-yet-event design to a balanced late-cohort association and therefore supplements rather than replaces the primary result. It also selects a different population: among initially eligible 2020–2022 event arenas, the standardized difference in log(1 + g−1 arena size) between included and failed arenas is 0.490, and the robust inclusion LPM coefficient for the 2022 cohort is −0.281 (p = .0005). Among never-observed-marker-event comparison arenas, complete-versus-failed standardized differences are 1.227 for lagged log size and 0.727 for size momentum. Thus, applying the same calendar-support contract removes the group-rule asymmetry but does not remove selection or establish causality.
<Table A3c> Symmetric future-observability support
| Administrative outcome | +1…+3 estimate (SE) | Raw / Holm p | Pointwise 95% CI | Fixed-cohort local pre-event p | Diagnostic implication |
|---|---|---|---|---|---|
| T2 administrative listing count | −0.0076 (0.0094) | .4200 / .4200 | [−0.0261, 0.0109] | .7337 | Negative direction attenuates and is not distinguishable from zero; the overall T2 evidence remains limited and definition-contingent |
| T3 administrative listing count | −0.1848 (0.1107) | .0952 / .1904 | [−0.4019, 0.0323] | .0612 | Direction remains opposite the originally predicted positive direction; the positive T3 association is not supported |
The listing outcomes are extremely sparse. Across the 43,798 primary event-study arena-year rows, total newly appearing listings average 0.0529: 42,985 transitions (98.14%) have none, 573 (1.31%) have one, and 240 (0.55%) have more than one; the maximum is 76. For T2, the mean is 0.0030, with 43,751 zero (99.893%), 27 one (0.062%), and 20 multiple-listing transitions (0.046%), and the variance-to-mean ratio is 6.21. For T3, the mean is 0.0191, with 43,578 zero (99.498%), 149 one (0.340%), and 71 multiple-listing transitions (0.162%), and the variance-to-mean ratio is 21.45. Contextual group-time any-listing estimates are −0.0171 for T2 (p = .0241, local pre-event p = .0929) and −0.0416 for T3 (p = .0024, local pre-event p = .0033); they do not replace the count outcome or the separate static binary LPM in Appendix A8, and the T3 extensive-margin pre-event test rejects.
The full event registry contains 1,439 first marker-event arenas. Only 129 events (8.96%) have a single TOP-position product in the entire arrival snapshot; 1,310 do not. Separately, 452 events (31.41%) contain more than one newly appearing TOP-position product in the marker year. The latter is not the count of all multiple-TOP-position-product events: an arrival snapshot may contain an incumbent/new-product TOP tie even when only one TOP-position product is newly appearing. There are 3,363 newly appearing TOP-position rows across first events, with a maximum of 45 in one event. Eligible appearance flows include 570 returns after an observation gap (3.21%), and 43 first marker events involve such a returning TOP listing. After the first event, 683 arenas have 2,094 later TOP-arrival arena-years. The retained event cohorts contain 70/104/127/45/21 arenas in 2019/2020/2021/2022/2023. Every quantity counts newly appearing listing flows classified in the arrival snapshot; none counts the tier reassignment or price movement of a continuously listed incumbent.
“Treated,” “control,” and “never-event” are software labels for event timing. Here, “never-event” means only that no qualifying marker arrival is observed during 2012–2025; it does not establish no pre-2012 event. These labels do not establish actor identity or exogeneity. In the primary estimand, eligibility conditions marker-event arenas on remaining administratively observable through g+2; the same event-specific future-support contract is not imposed on never-observed-marker-event comparisons. The symmetric restriction applies one common 2017–2025 observability rule, but it changes the estimand and produces a demonstrably selected late-cohort sample rather than a causal fix. Absent arena-years are not imputed as zero and may reflect risk-set exit, no eligible reimbursed listing, or a bridge/eligibility break. The estimand therefore does not generalize automatically to the 813 marker events without initial support or the 206 events that lose support after 2016 removal. Long-window averages are cohort-limited summaries, not equally supported extensions of the shorter window.
A4. Dynamic Coefficients, Joint Pre-Event Diagnostics, and Inferential Ceiling
The dynamic-coefficient audit reports the primary administrative results and the pre-event evidence needed to interpret them. Figure 1 reports the complete displayed coefficient path, which is not duplicated here.
The primary estimator is a Callaway–Sant’Anna group-time design with outcome-regression estimation, not-yet-event controls, event time −1 as the universal base period, arena clustering, and multiplier-bootstrap simultaneous bands. Let Δ(g,e) denote the group-time contrast relative to event time −1. At each event time, the aggregation procedure averages available Δ(g,e) values with normalized cohort-share weights; the +1 to +3 estimand equally averages the three event-time aggregates. Requiring support through event time +3 restricts that estimand to the 2019–2022 cohorts, while available group-time observations enter without imputing missing arena-years. Estimates are described as cohort-share-weighted event-time associations.
The full +1…+3 baseline decomposition is +0.5107 for TOP-position listings, −0.0562 for T1, −0.0172 for T2, −0.5340 for T3, and −0.0782 for T4. These coefficients sum to the total-listing estimate of −0.1749 (p = .5205). This is a contextual arithmetic decomposition, not a formal cross-position equality test, a composition-shift estimate, or a causal reallocation estimate. The TOP lead test is unavailable, and the T3, T4, and total outcomes reject at least one joint pre-event test.
<Table A4> Administrative listing associations and retrospective classifications
| Outcome | +1…+3 estimate (SE), p | Pre-event p: local / wide / all | +1…+5 estimate (SE), p | Retrospective classification |
|---|---|---|---|---|
| T2 administrative listing count | −0.0172 (0.0083), .0369 | .1144 / .0731 / .0731 | −0.0372 (0.0155), .0166 | Negative baseline, but event-definition sign reversal and common-support attenuation make the association limited and definition-contingent |
| T3 administrative listing count | −0.5340 (0.2358), .0236 | .0185 / .0255 / .0255 | −0.9650 (0.4572), .0348 | Opposite the originally predicted positive direction, with rejected pre-event tests; positive T3 association not supported |
For T2, the lead estimates at −5, −4, −3, and −2 are −0.0279, +0.0029, −0.0042, and −0.0158; simultaneous intervals are [−0.0561, +0.0004], [−0.0404, +0.0461], [−0.0268, +0.0184], and [−0.0357, +0.0041]. The nonrejections are inconclusive because no equivalence margin was specified and the cohort set changes across leads. The +3 estimate is −0.0230 with simultaneous interval [−0.0408, −0.0051], but localized precision does not override core event-definition reversals.
For T3, the corresponding leads are −0.7923, −0.7118, −0.1874, and −0.5491; simultaneous intervals are [−1.5860, +0.0015], [−1.3974, −0.0262], [−0.3822, +0.0074], and [−1.0946, −0.0037]. Several supported leads are already negative, while core event restrictions yield small positive but imprecise post estimates. The longer windows in the display rely on only two complete cohorts and 168 treated observations at +5.
The symmetric panel also supplies a stable-cohort lead diagnostic. The cohort set is fixed at 2020–2022 at every displayed event time, and the same 96, 111, and 28 event arenas from those cohorts contribute at −3, −2, +1, +2, and +3; all 2,240 never-event comparison arenas are present throughout. For T2, the −3 and −2 estimates are −0.00095 (SE = 0.00955, p = .9208) and −0.00551 (SE = 0.01012, p = .5861), and their two-lead joint test gives p = .7337. For T3, the corresponding estimates are −0.22379 (SE = 0.10994, raw p = .0418) and −0.20373 (SE = 0.11731, p = .0825), with joint p = .0612. The T3 −3 simultaneous interval is [−0.4458, −0.0018], and its p-value is .0836 after Holm adjustment across the T2/T3 outcomes at that event time. Nonrejection of the joint test is neither an equivalence result nor confirmation of parallel trends; the T3 path remains concerning because the −3 simultaneous interval excludes zero even though the two-lead joint p-value is just above .05. The T2 evidence remains limited because its negative direction is not stable in the definition-sensitivity grid, and the originally predicted positive T3 direction is not supported.
A statistically nonzero coefficient does not override sign instability, rejected or inconclusive pre-event diagnostics, or thin horizon support. Post-event mediation and identity are not tested: post-event T3 stock is excluded as a mediator/control, and the data contain no direct identity, detailing, reputation, formulary, or demand measure.
The retrospective classification rule was documented after review and applied to both marker directions; it was not preregistered or set before the original results were known.
A5. Temporal Classification, Tier Cutoffs, and Continuous Position Checks
The temporal-classification audit asks whether assigning price position at arrival rather than at the 2025 endpoint changes the same listing-appearance records; checks using the descriptive 10/30/70 partition and tie-aware percentile formula are secondary marker sensitivities.
Of 2,316 transitions in the paired-classification sample, 1,446 remain in the same arena and can be classified under both timing schemes; only 778 of those rows (53.80%) retain the same category. Holding those rows fixed, endpoint-minus-historical classification changes the T3 association by +0.2728 (SE = 0.0879, p = .0019) but changes T2 by −0.0011 (SE = 0.0139, p = .9363). Tables A5a–A5b report the full paired evidence below.
<Table A5a> Descriptive historical-listing versus 2025-endpoint position cross-tabulation on exact same-arena matches
| Historical position | Endpoint TOP | Endpoint T1 | Endpoint T2 | Endpoint T3 | Endpoint T4 | Row total |
|---|---|---|---|---|---|---|
| TOP | 124 | 2 | 5 | 188 | 15 | 334 |
| T1 | 27 | 4 | 1 | 4 | 2 | 38 |
| T2 | 44 | 3 | 29 | 7 | 8 | 91 |
| T3 | 66 | 1 | 20 | 330 | 81 | 498 |
| T4 | 79 | 2 | 16 | 97 | 291 | 485 |
| Column total | 340 | 12 | 71 | 626 | 397 | 1,446 |
<Table A5b> Paired endpoint-classification accounting, +1…+3
| Diagnostic outcome | A: all historical | B: matched, historical coding | C: same rows, endpoint coding | Delta: C−B |
|---|---|---|---|---|
| T2 listing count | −0.0172 (0.0083), p=.0369 | −0.0071 (0.0061), p=.2409 | −0.0082 (0.0137), p=.5491 | −0.0011 (0.0139), p=.9363 |
| T3 listing count | −0.5340 (0.2358), p=.0236 | −0.3581 (0.2049), p=.0805 | −0.0853 (0.1500), p=.5696 | +0.2728 (0.0879), p=.0019 |
Marker specification. All products tied at the arena-year maximum listed reimbursement amount are coded TOP. Non-TOP products use the tie-aware score (descending midrank−1)/(arena size−1). The main descriptive boundaries are 10%, 30%, and 70%; alternatives are 5/25/65 and 15/35/75. The alternative score, descending midrank/arena size, is also reconstructed. These thresholds are markers, not theoretically identified discontinuities.
Under the main partition, T1 covers non-TOP scores at or below 10%, T2 covers scores above 10% through 30%, T3 covers scores above 30% through 70%, and T4 covers scores above 70%. A newly appearing product’s tier is assigned in the listing snapshot and is therefore an outcome category. Delisting and cancellation analyses instead use the incumbent’s preceding-snapshot tier.
The T2 +1…+3 estimate varies from −0.0730 under 5/25/65 (p = .0178) to −0.0147 under 15/35/75 (p = .2439). Under the alternative rank/N formula, it is −0.0177 (p = .0736), and the wide pre-event test rejects (p = .0349). The T3 estimates remain negative under all three alternatives, approximately −0.542 to −0.551, while their local and wide pre-event tests reject. Thus, cutoff choice changes T2 magnitude and statistical status but does not restore the predicted T3 direction.
Continuous and decile summaries avoid a four-tier threshold. At +1, +2, and +3, mean total new listings are 1.2534, 0.5341, and 0.0959; corresponding mean percentile mass is 0.6251, 0.2519, and 0.0444. These are raw event-time descriptions rather than counterfactual estimates.
The endpoint-pairing analysis uses the 2025-01-01 snapshot and requires an exact item-identifier-by-contemporaneous-HIRA-arena match. Of 2,316 transitions in the paired-classification sample, 1,446 (62.44%) are present in the same arena in 2025, 128 are observed only in another arena, and 742 are absent; across all 17,747 eligible historical listing-appearance rows, the same-arena endpoint match is 10,685 (60.21%). The table below cross-tabulates the 1,446 primary-analysis rows that can be classified both ways. Rows use contemporaneous historical position at listing; columns use 2025 endpoint position.
Only 778 of 1,446 matched rows (53.80%) remain in the same administrative position category. The paired outcome comparison holds these 1,446 listing-appearance rows fixed. A is the full primary-panel historical result using all 2,316 paired-classification transitions, B retains only endpoint-matchable rows but classifies them at their listing-year historical positions, C reclassifies those same rows at their 2025 endpoint positions, and Delta directly estimates C−B at the arena-year level.
For T2, the point estimate attenuates from A to B, while the directly estimated paired C−B difference is −0.0011 (SE = 0.0139, 95% CI [−0.0283, 0.0261], p=.9363). This is not an equivalence test, cannot exclude a substantively nonzero recoding difference, and cannot causally allocate the original contrast among matching, survival, classification, and other panel-construction differences. For T3, both the B−A point-estimate change and the directly estimated Delta reduce the negative magnitude; Delta is +0.2728 (SE = 0.0879, 95% CI [0.1005, 0.4451], p=.0019). The local/wider pre-event joint-test p-values for Delta are .9712/.5668 for T2 and .1170/.2108 for T3. The local pre-event p-values for B/C are .1829/.5933 for T2 but .0167/.0204 for T3, so the paired T3 comparison remains a measurement diagnostic rather than an identified effect. The point-estimate accounting shows why contemporaneous historical coding is required and that endpoint coding produces a numerically material difference among matched T3 transitions. It does not prove that the retained historical association is causal, eliminate event-timing endogeneity, or adjudicate either theory-level direction.
Price rank is an administrative position marker, not competitive distance itself. No cutoff is selected after observing its coefficient.
A6. Unit, Bridge, and Arena-Restriction Sensitivities
The unit and bridge checks assess whether item aggregation, bridge type, arena concordance, or multi-arena exposure drives the primary results.
The descriptive code panel contains 287,871 eligible records, 44,345 reimbursement codes, and 8,225 arenas. In the final model, the code-by-arena sensitivity uses 36,450 arena-years and 6,137 arenas. Its +1…+3 estimates are −0.0127 for T2 (p = .1230) and −0.3509 for T3 (p = .0849); T2’s local pre-event test narrowly rejects (p = .0493).
Unit and bridge restrictions vary materially. Requiring the revised-product-code bridge to be available in every observed snapshot yields approximately zero for T2 (−0.0010, p = .9519) and −0.2410 for T3 (p = .1836), with a T3 wide-test rejection. This restriction concerns bridge availability, not invariance of the product code over time. The current-MFDS-arena-agreement sample yields −0.0201 for T2 (p = .1852) and −0.3658 for T3 (p = .1310). The single-HIRA-arena restriction amplifies the estimates to −0.0424 for T2 (p = .0050) and −1.0521 for T3 (p = .0217), but T3’s local pre-event test rejects. Excluding items ever observed concurrently in multiple arenas yields −0.0290 for T2 (p = .0261) and −0.8181 for T3 (p = .0191), again with rejected T3 pre-event tests.
The all-snapshot revised-product-code-bridge-availability restriction retains 25,687 arena-years and 3,114 arenas; the MFDS-arena-agreement restriction retains 24,283 and 2,978; the single-arena restriction retains 25,199 and 3,478; and the never-concurrent-multi-arena restriction retains 32,344 and 4,842. All retain five event cohorts. Reporting these denominators prevents a stronger coefficient in a smaller restriction from being interpreted automatically as better identification.
Restrictions answer different measurement questions and are not combined into a post hoc “clean” sample. Current MFDS arena is never backfilled into history, and a favorable restriction does not replace the primary result.
A7. Transition-Year, Prior-Maximum, and Single-TOP-Product Event Checks
The event checks assess sensitivity to administrative transition timing, ties at the TOP position, and focal listings below the preceding arena maximum.
Including 2016 expands the sample to nine cohorts and produces much larger negative +1…+3 estimates: −0.2015 for T2 (p = .0012) and −0.9192 for T3 (p < .001). Both outcomes then reject local and wide pre-event tests. This specification confirms the importance of the structural break; it is not selected as a stronger result.
The include-2016 panel contains 50,208 arena-years and 7,264 arenas. Excluding 2016 and 2017 leaves 38,752 arena-years, 6,553 arenas, and four cohorts. Excluding 2016 and 2019 leaves 37,317 arena-years, 6,669 arenas, and only two cohorts. These changes in support are reported alongside every coefficient because a transition restriction changes both event composition and available horizons.
Excluding both 2016 and 2017 attenuates the estimates to −0.0104 for T2 (p = .1930) and −0.1508 for T3 (p = .1281). Excluding 2016 and 2019 leaves only two cohorts and reverses both signs: +0.0008 for T2 (p = .8341) and +0.1058 for T3 (p = .4638). Long windows are unavailable; for T3, the local and fixed four-lead wide tests are unavailable, while the all-supported-lead test rejects (p = .0157).
Requiring the full first-event arrival snapshot to contain a single TOP-position product also reverses the signs: +0.0138 for T2 (p = .5214) and +0.0855 for T3 (p = .2551), with a T3 wide-test rejection. Requiring the focal listing to meet or exceed the preceding arena maximum yields approximately zero/positive estimates: +0.0001 for T2 (p = .9918) and +0.0108 for T3 (p = .5636), again with a rejected T3 wide test.
The single-TOP-position-product restriction retains 41,234 arena-years and 6,670 arenas; the prior-maximum restriction retains 43,125 and 6,895. Each retains five cohorts. Their positive point estimates are not precise evidence of an opposite effect; their role is to show that the negative main direction depends on how a TOP-position arrival is defined.
Excluded events are never retimed. These sign reversals make the T2 association definition-contingent and do not support the originally predicted positive T3 direction. They do not identify a competitive mechanism.
A8. Binary, Linear-Count, Poisson, and Cohort-Robust Reconciliation
The estimator reconciliation compares alternative estimators together with the samples they retain.
Estimator agreement must be read together with the observations and arenas each model actually retains.
Static linear estimates are −0.0114 for T2 (p = .0085) and −0.1159 for T3 (p = .0495); binary any-listing estimates are −0.0078 (p = .0092) and −0.0044 (p = .4148). Sun–Abraham coefficients are generally negative, but T2 leads at −5 and −2 reject pointwise, and all reported T3 leads from −5 through −2 reject. Poisson log-rate coefficients are −2.5588 for T2 (SE = 0.7699, p < .001) and −2.1664 for T3 (SE = 0.7508, p = .0039), but their nominal precision cannot compensate for deleting more than 97% of arenas.
<Table A8> Estimator sample retention
| Estimator or panel | Outcome | Rows | Arenas | Row / arena retention |
|---|---|---|---|---|
| Primary group-time panel | T2 and T3 | 43,798 | 6,971 | 100.0% / 100.0% |
| Linear TWFE, binary LPM, Sun–Abraham | T2 and T3 | 43,199 | 6,372 | 98.6% / 91.4% |
| Poisson TWFE | T2 | 363 | 44 | 0.83% / 0.63% |
| Poisson TWFE | T3 | 1,497 | 175 | 3.42% / 2.51% |
The group-time export accounts for all 120 expected cells: 80 estimated normally, 20 weak-support cells, 10 universal-reference cells, and 10 physically removed event-year cells. There are no nonexpected estimation failures. The 120-cell total refers to the complete exported index, including estimated, weak-support, reference, and physically removed cells; the displayed raw-support grid is a reporting subset rather than the full index.
The estimators target different quantities. Agreement in sign cannot repair a pre-event path that is incompatible with the identifying restriction, event-definition instability, or severe Poisson selection.
A9. One-Snapshot and Persistent HIRA Reimbursement Delisting
The delisting analysis assigns risk-set tier before disappearance and censors identifiable arena migration.
For prior-T2 incumbents, one-snapshot HIRA delisting is −0.0014 over +1…+3 (p = .7616), and persistent delisting is +0.0015 (p = .7220). For prior-T3 incumbents, the corresponding estimates are −0.0075 (p = .6925) and −0.0120 (p = .4886). T3 wide pre-event tests reject for both measures (p = .0044 and .0070).
Over +1…+5, prior-T2 one-snapshot and persistent estimates are +0.0013 (p = .8848) and +0.0070 (p = .0495); prior-T3 estimates are approximately zero (p = .9977) and −0.0400 (p = .1168). Because the five-year window has only two complete cohorts, the isolated persistent-T2 p value is horizon-limited and does not establish a stable tier response.
Total one-snapshot delisting is +0.1369 (p = .0555), and total persistent delisting is +0.1873 (p = .0093), but their wide pre-event tests reject. A nominally nonzero persistent T2 result over +1…+5 also relies on only two complete cohorts and does not align with the short-window or one-snapshot result.
HIRA disappearance is reimbursement delisting, not commercial exit. Tier-specific nulls and rejected total-outcome pre-event tests prevent a survival or crowding claim.
A10. MFDS Regulatory Cancellation and Event-Time −1 Post-Only Landmark Description
The cancellation analysis separates MFDS regulatory cancellation from HIRA reimbursement disappearance, while the event-time −1 tier landmark remains descriptive.
Prior-T2 MFDS cancellation is +0.0012 over +1…+3 (p = .3868), and prior-T3 cancellation is +0.0040 (p = .5476). The T3 wide pre-event test rejects (p = .0041). Total cancellation is positive (+0.0643, p < .001) but its wide pre-event test also rejects strongly. The tier-specific cancellation and HIRA-delisting results therefore do not form one coherent departure pattern.
The g−1 tier landmark is post-only. Falling denominators expose unequal horizon support, and the difference between raw same-arena absence and migration-censored absence is recorded as other-arena presence rather than disappearance.
MFDS cancellation is a regulatory outcome, not commercial exit. The event-time −1 tier file has no lead structure and cannot identify survival, category stabilization, identity, or post-event mediation.
<Table A10> Event-time −1 incumbent landmark
| Event-time −1 tier | Horizon | Items | HIRA absent, raw | Other-arena migration | HIRA absent, migration-censored | MFDS cancelled |
|---|---|---|---|---|---|---|
| T2 | +1 | 62 | 6 (9.7%) | 1 (1.6%) | 5 (8.1%) | 1 (1.6%) |
| T2 | +3 | 57 | 10 (17.5%) | 1 (1.8%) | 9 (15.8%) | 4 (7.0%) |
| T2 | +5 | 36 | 8 (22.2%) | 1 (2.8%) | 7 (19.4%) | 2 (5.6%) |
| T3 | +1 | 412 | 25 (6.1%) | 6 (1.5%) | 19 (4.6%) | 10 (2.4%) |
| T3 | +3 | 406 | 88 (21.7%) | 7 (1.7%) | 81 (20.0%) | 30 (7.4%) |
| T3 | +5 | 312 | 87 (27.9%) | 6 (1.9%) | 81 (26.0%) | 23 (7.4%) |
A11. Predetermined Size/Momentum and Control-Group Sensitivities
The final sensitivity checks examine predetermined arena trajectory and comparison-group choice without introducing post-event controls.
Size and momentum are measured from each event arena’s g−2 and g−1 observations; comparison-group covariate years were fixed before the supplementary models were estimated.
<Table A11> Predetermined-covariate and comparison-group diagnostics
| Specification | Outcome | +1…+3 estimate (SE), p | Pre-event p: local / wide | Rows / arenas |
|---|---|---|---|---|
| Predetermined size and momentum | T2 | −0.0169 (0.0088), .0546 | .1388 / .0879 | 24,982 / 3,458 |
| Predetermined size and momentum | T3 | −0.5299 (0.2347), .0240 | .0168 / .0137 | 24,982 / 3,458 |
| Never-event-only controls | T2 | −0.0169 (0.0084), .0447 | .1137 / .0789 | 43,798 / 6,971 |
| Never-event-only controls | T3 | −0.5334 (0.2486), .0319 | .0184 / .0252 | 43,798 / 6,971 |
The T2 nonrejections remain inconclusive rather than validating, and the adjusted T3 pre-event tests reject. Similarity under never-event-only controls shows that admitting future-event arenas before exposure does not drive the headline coefficients; it does not establish exogeneity.
No contemporaneous size, post-event stock, future price, or future tier enters as a control. In particular, post-event T3 stock is not used to claim mediation.
A12. Diagnostic Scope and Inferential Status
The final audit distinguishes inherited, retrospective, and post-review analyses and records how each uncertainty display is used. This sequence does not convert retrospective work into prospective confirmation.
The supplementary record retains favorable, null, and adverse evidence under one reporting rule. T2 is classified as limited and definition-contingent because the primary negative estimate reverses when the first-event arrival snapshot is restricted to a single TOP-position product and attenuates under common support. The predicted positive T3 direction is not supported: the primary association is negative and its lead diagnostics raise design concerns. Both conclusions apply to administrative bins rather than shadow–spotlight regions.
<Table A12a> Diagnostic sequence and evidentiary status
| Stage | Analysis state | Inferential status |
|---|---|---|
| Original submission | The negative T2 and positive T3 directions, endpoint classification, and original results already existed | Retrospective benchmark |
| Historical reconstruction and primary reanalysis | Primary estimates and ten-specification sensitivity results were available before the current classifications | Results were known before classification |
| Supplementary diagnostics | Common-support, stable-cohort, endpoint-pairing, sparsity, and event-semantic rules were fixed before execution | Revision-stage diagnostics; not preregistered confirmation |
| Manuscript interpretation | Favorable, null, and adverse findings were reported under the same interpretive limits | Worked measurement audit; no theory verdict |
Note. The supplementary diagnostic rules were fixed before those diagnostics were run. The broader design, ten-specification family, and T2/T3 classifications were not preregistered and are not treated as confirmatory.
<Table A12b> Statistical role and uncertainty map
| Analysis object | Uncertainty display | Role in this paper | Decision use |
|---|---|---|---|
| Primary +1 to +3 T2/T3 summaries | Unadjusted p-values and pointwise intervals | Descriptive administrative associations in a selected risk set | Do not determine a theory verdict |
| Dynamic paths | Pointwise intervals plus simultaneous band within each outcome path | Diagnose timing, support, and pre-event behavior | No pointwise significance coding in marker fill |
| Joint lead tests | Local and wider Wald diagnostics | Flag incompatible pre-event paths; nonrejection is not equivalence | Can narrow, never enlarge, the admissible claim |
| Ten-row definition-sensitivity grid | Unadjusted pointwise intervals | Compare nonexchangeable marker, event, unit, and bridge definitions | Retrospective implementation audit, not a model vote |
| Common-support T2/T3 pair | Raw and local two-outcome Holm values | Diagnose risk-set and cohort sensitivity | Local sensitivity only; not familywise confirmation |
| Endpoint, estimator, and departure analyses | Unadjusted diagnostic uncertainty unless stated | Bound classification, attrition, endpoint, and outcome semantics | Cannot restore theory-bearing status |
The supplementary diagnostics first reproduced the two primary T2/T3 models and then added the new analyses. Analysis code, machine-readable outputs, and supporting records are retained separately. These materials document reporting integrity; causal identification, actor identity, competitive distance, strategic behavior, and the shadow–spotlight mechanism remain outside their evidentiary scope.
Author Biographies
∙ Gwangyeong Lim is a doctoral researcher at SNU Business School, Seoul National University, where he completed the PhD coursework. His research focuses on interfirm competition, market-position measurement, and strategic inference from administrative data.